Puget Sound Salish vs Immigrants from Spain 8th Grade
COMPARE
Puget Sound Salish
Immigrants from Spain
8th Grade
8th Grade Comparison
Puget Sound Salish
Immigrants from Spain
96.5%
8TH GRADE
99.3/ 100
METRIC RATING
79th/ 347
METRIC RANK
95.7%
8TH GRADE
38.7/ 100
METRIC RATING
181st/ 347
METRIC RANK
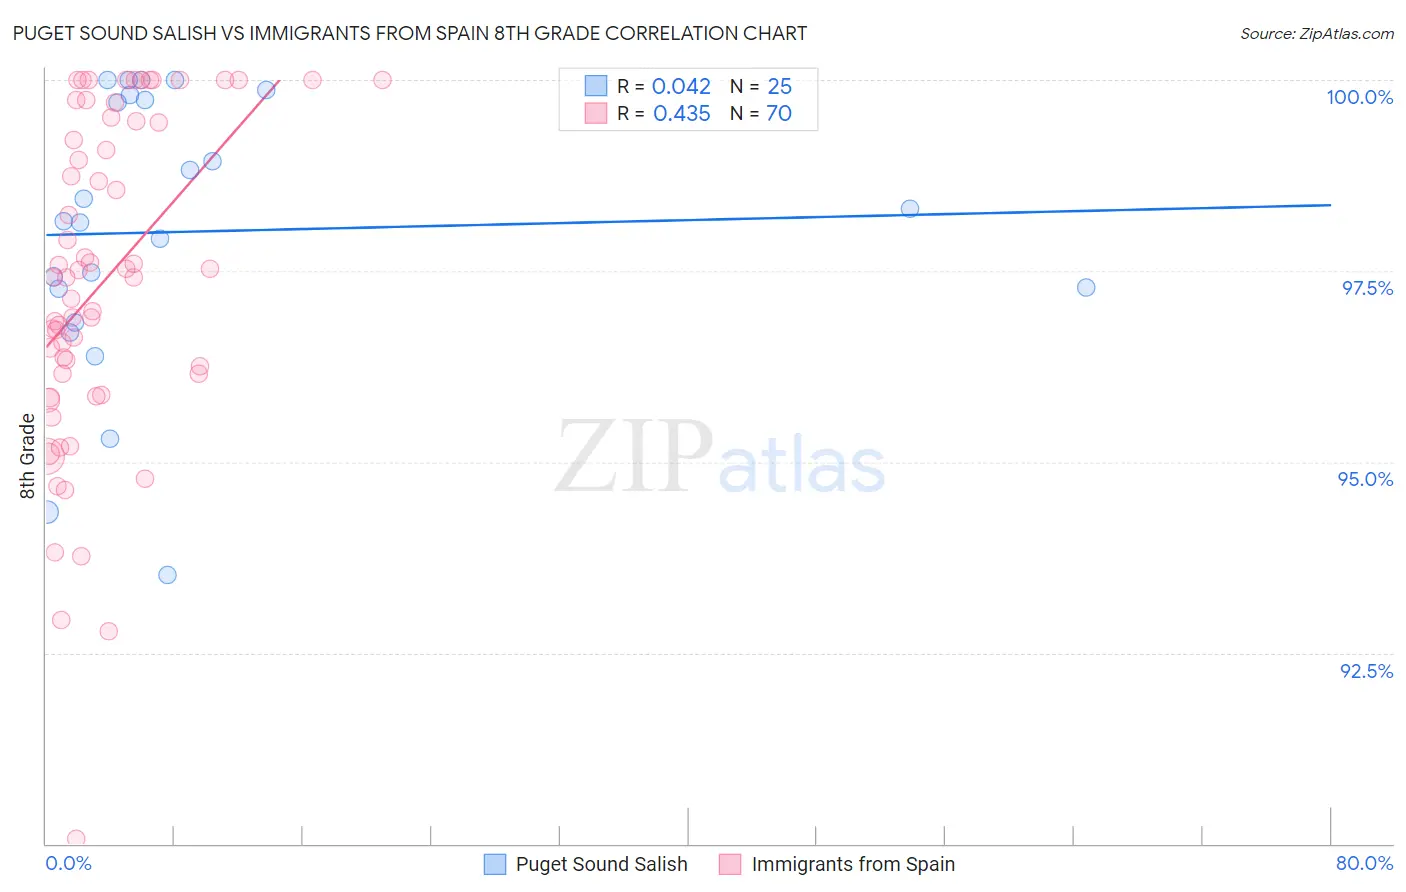
Puget Sound Salish vs Immigrants from Spain 8th Grade Correlation Chart
The statistical analysis conducted on geographies consisting of 46,155,775 people shows no correlation between the proportion of Puget Sound Salish and percentage of population with at least 8th grade education in the United States with a correlation coefficient (R) of 0.042 and weighted average of 96.5%. Similarly, the statistical analysis conducted on geographies consisting of 239,679,100 people shows a moderate positive correlation between the proportion of Immigrants from Spain and percentage of population with at least 8th grade education in the United States with a correlation coefficient (R) of 0.435 and weighted average of 95.7%, a difference of 0.88%.
8th Grade Correlation Summary
| Measurement | Puget Sound Salish | Immigrants from Spain |
| Minimum | 93.5% | 90.1% |
| Maximum | 100.0% | 100.0% |
| Range | 6.5% | 9.9% |
| Mean | 98.0% | 97.4% |
| Median | 98.2% | 97.4% |
| Interquartile 25% (IQ1) | 97.0% | 96.1% |
| Interquartile 75% (IQ3) | 99.8% | 99.5% |
| Interquartile Range (IQR) | 2.7% | 3.3% |
| Standard Deviation (Sample) | 1.8% | 2.1% |
| Standard Deviation (Population) | 1.8% | 2.1% |
Similar Demographics by 8th Grade
Demographics Similar to Puget Sound Salish by 8th Grade
In terms of 8th grade, the demographic groups most similar to Puget Sound Salish are Cypriot (96.5%, a difference of 0.020%), Yugoslavian (96.5%, a difference of 0.020%), Delaware (96.5%, a difference of 0.020%), Romanian (96.5%, a difference of 0.020%), and Turkish (96.5%, a difference of 0.020%).
| Demographics | Rating | Rank | 8th Grade |
| Immigrants | England | 99.5 /100 | #72 | Exceptional 96.6% |
| Arapaho | 99.5 /100 | #73 | Exceptional 96.6% |
| Immigrants | Ireland | 99.5 /100 | #74 | Exceptional 96.5% |
| Zimbabweans | 99.4 /100 | #75 | Exceptional 96.5% |
| Immigrants | Netherlands | 99.4 /100 | #76 | Exceptional 96.5% |
| Cypriots | 99.4 /100 | #77 | Exceptional 96.5% |
| Yugoslavians | 99.4 /100 | #78 | Exceptional 96.5% |
| Puget Sound Salish | 99.3 /100 | #79 | Exceptional 96.5% |
| Delaware | 99.2 /100 | #80 | Exceptional 96.5% |
| Romanians | 99.2 /100 | #81 | Exceptional 96.5% |
| Turks | 99.2 /100 | #82 | Exceptional 96.5% |
| Icelanders | 99.2 /100 | #83 | Exceptional 96.5% |
| Immigrants | Belgium | 99.1 /100 | #84 | Exceptional 96.5% |
| Immigrants | South Africa | 99.1 /100 | #85 | Exceptional 96.5% |
| Cherokee | 99.0 /100 | #86 | Exceptional 96.5% |
Demographics Similar to Immigrants from Spain by 8th Grade
In terms of 8th grade, the demographic groups most similar to Immigrants from Spain are Iraqi (95.7%, a difference of 0.010%), Immigrants from Egypt (95.7%, a difference of 0.010%), Immigrants from Iraq (95.6%, a difference of 0.020%), Immigrants from Uganda (95.6%, a difference of 0.020%), and Black/African American (95.6%, a difference of 0.030%).
| Demographics | Rating | Rank | 8th Grade |
| Chileans | 50.0 /100 | #174 | Average 95.7% |
| Immigrants | Albania | 49.6 /100 | #175 | Average 95.7% |
| Pakistanis | 48.8 /100 | #176 | Average 95.7% |
| Marshallese | 47.6 /100 | #177 | Average 95.7% |
| Venezuelans | 47.5 /100 | #178 | Average 95.7% |
| Immigrants | Brazil | 45.4 /100 | #179 | Average 95.7% |
| Iraqis | 40.5 /100 | #180 | Average 95.7% |
| Immigrants | Spain | 38.7 /100 | #181 | Fair 95.7% |
| Immigrants | Egypt | 37.9 /100 | #182 | Fair 95.7% |
| Immigrants | Iraq | 36.2 /100 | #183 | Fair 95.6% |
| Immigrants | Uganda | 36.0 /100 | #184 | Fair 95.6% |
| Blacks/African Americans | 34.8 /100 | #185 | Fair 95.6% |
| Brazilians | 34.8 /100 | #186 | Fair 95.6% |
| Sudanese | 33.0 /100 | #187 | Fair 95.6% |
| Liberians | 32.4 /100 | #188 | Fair 95.6% |