Peruvian vs Immigrants from Spain 8th Grade
COMPARE
Peruvian
Immigrants from Spain
8th Grade
8th Grade Comparison
Peruvians
Immigrants from Spain
94.7%
8TH GRADE
0.1/ 100
METRIC RATING
276th/ 347
METRIC RANK
95.7%
8TH GRADE
38.7/ 100
METRIC RATING
181st/ 347
METRIC RANK
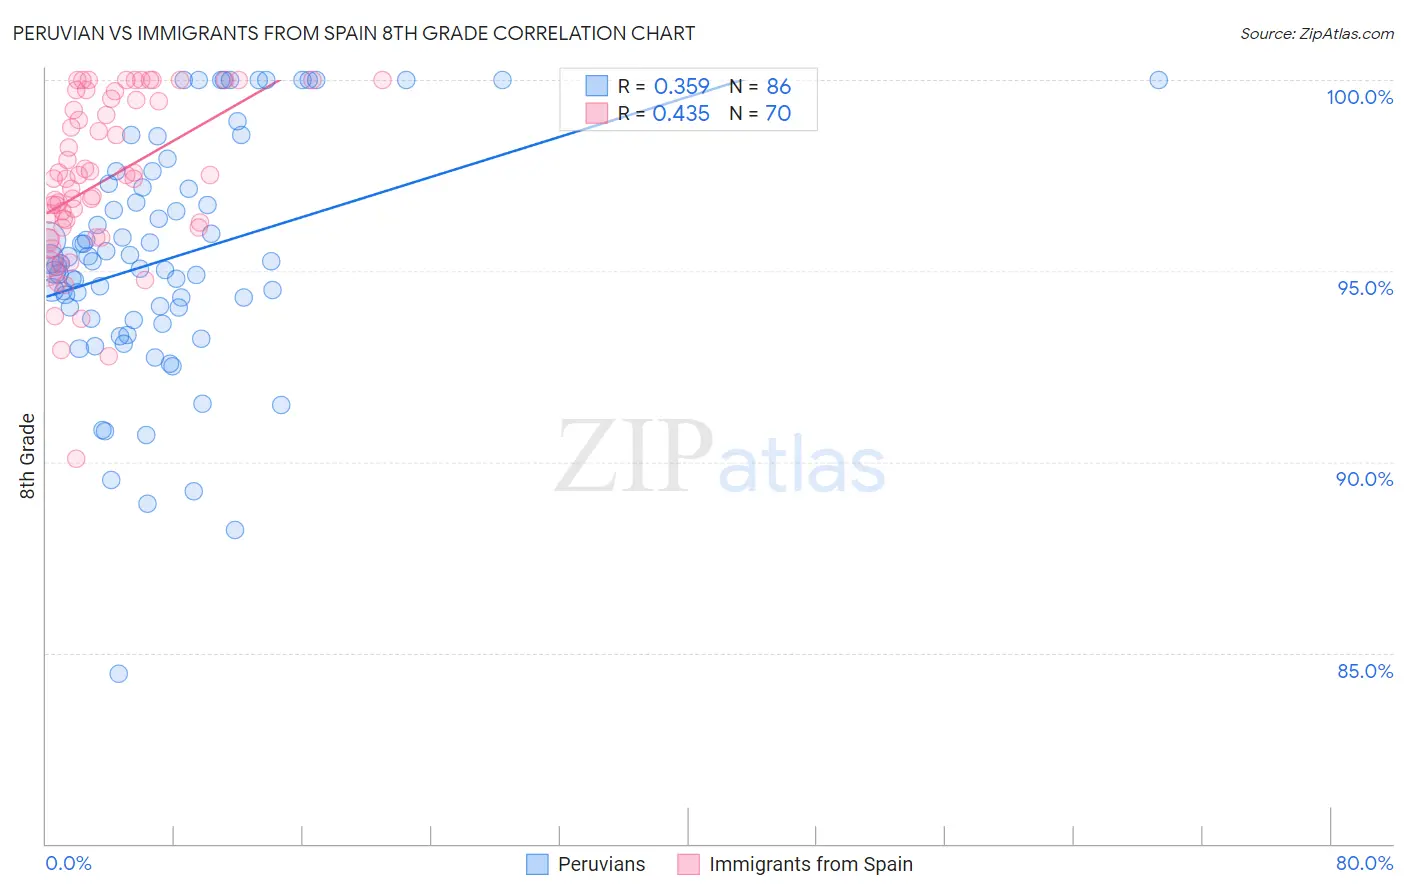
Peruvian vs Immigrants from Spain 8th Grade Correlation Chart
The statistical analysis conducted on geographies consisting of 363,251,075 people shows a mild positive correlation between the proportion of Peruvians and percentage of population with at least 8th grade education in the United States with a correlation coefficient (R) of 0.359 and weighted average of 94.7%. Similarly, the statistical analysis conducted on geographies consisting of 239,679,100 people shows a moderate positive correlation between the proportion of Immigrants from Spain and percentage of population with at least 8th grade education in the United States with a correlation coefficient (R) of 0.435 and weighted average of 95.7%, a difference of 1.0%.
8th Grade Correlation Summary
| Measurement | Peruvian | Immigrants from Spain |
| Minimum | 84.4% | 90.1% |
| Maximum | 100.0% | 100.0% |
| Range | 15.6% | 9.9% |
| Mean | 95.3% | 97.4% |
| Median | 95.2% | 97.4% |
| Interquartile 25% (IQ1) | 93.8% | 96.1% |
| Interquartile 75% (IQ3) | 97.2% | 99.5% |
| Interquartile Range (IQR) | 3.4% | 3.3% |
| Standard Deviation (Sample) | 3.1% | 2.1% |
| Standard Deviation (Population) | 3.1% | 2.1% |
Similar Demographics by 8th Grade
Demographics Similar to Peruvians by 8th Grade
In terms of 8th grade, the demographic groups most similar to Peruvians are Immigrants from Colombia (94.7%, a difference of 0.030%), Taiwanese (94.7%, a difference of 0.030%), Trinidadian and Tobagonian (94.7%, a difference of 0.040%), Immigrants from Western Africa (94.8%, a difference of 0.050%), and Immigrants from South America (94.8%, a difference of 0.060%).
| Demographics | Rating | Rank | 8th Grade |
| Immigrants | Thailand | 0.2 /100 | #269 | Tragic 94.8% |
| Immigrants | Uzbekistan | 0.2 /100 | #270 | Tragic 94.8% |
| Immigrants | Afghanistan | 0.2 /100 | #271 | Tragic 94.8% |
| Immigrants | South America | 0.2 /100 | #272 | Tragic 94.8% |
| Immigrants | Western Africa | 0.2 /100 | #273 | Tragic 94.8% |
| Trinidadians and Tobagonians | 0.2 /100 | #274 | Tragic 94.7% |
| Immigrants | Colombia | 0.2 /100 | #275 | Tragic 94.7% |
| Peruvians | 0.1 /100 | #276 | Tragic 94.7% |
| Taiwanese | 0.1 /100 | #277 | Tragic 94.7% |
| Armenians | 0.1 /100 | #278 | Tragic 94.7% |
| Immigrants | Trinidad and Tobago | 0.1 /100 | #279 | Tragic 94.6% |
| Barbadians | 0.1 /100 | #280 | Tragic 94.6% |
| Immigrants | Bolivia | 0.1 /100 | #281 | Tragic 94.6% |
| Immigrants | Eritrea | 0.1 /100 | #282 | Tragic 94.6% |
| Immigrants | St. Vincent and the Grenadines | 0.1 /100 | #283 | Tragic 94.6% |
Demographics Similar to Immigrants from Spain by 8th Grade
In terms of 8th grade, the demographic groups most similar to Immigrants from Spain are Iraqi (95.7%, a difference of 0.010%), Immigrants from Egypt (95.7%, a difference of 0.010%), Immigrants from Iraq (95.6%, a difference of 0.020%), Immigrants from Uganda (95.6%, a difference of 0.020%), and Black/African American (95.6%, a difference of 0.030%).
| Demographics | Rating | Rank | 8th Grade |
| Chileans | 50.0 /100 | #174 | Average 95.7% |
| Immigrants | Albania | 49.6 /100 | #175 | Average 95.7% |
| Pakistanis | 48.8 /100 | #176 | Average 95.7% |
| Marshallese | 47.6 /100 | #177 | Average 95.7% |
| Venezuelans | 47.5 /100 | #178 | Average 95.7% |
| Immigrants | Brazil | 45.4 /100 | #179 | Average 95.7% |
| Iraqis | 40.5 /100 | #180 | Average 95.7% |
| Immigrants | Spain | 38.7 /100 | #181 | Fair 95.7% |
| Immigrants | Egypt | 37.9 /100 | #182 | Fair 95.7% |
| Immigrants | Iraq | 36.2 /100 | #183 | Fair 95.6% |
| Immigrants | Uganda | 36.0 /100 | #184 | Fair 95.6% |
| Blacks/African Americans | 34.8 /100 | #185 | Fair 95.6% |
| Brazilians | 34.8 /100 | #186 | Fair 95.6% |
| Sudanese | 33.0 /100 | #187 | Fair 95.6% |
| Liberians | 32.4 /100 | #188 | Fair 95.6% |