Macedonian vs Immigrants from Colombia High School Diploma
COMPARE
Macedonian
Immigrants from Colombia
High School Diploma
High School Diploma Comparison
Macedonians
Immigrants from Colombia
91.1%
HIGH SCHOOL DIPLOMA
99.7/ 100
METRIC RATING
54th/ 347
METRIC RANK
87.6%
HIGH SCHOOL DIPLOMA
1.0/ 100
METRIC RATING
254th/ 347
METRIC RANK
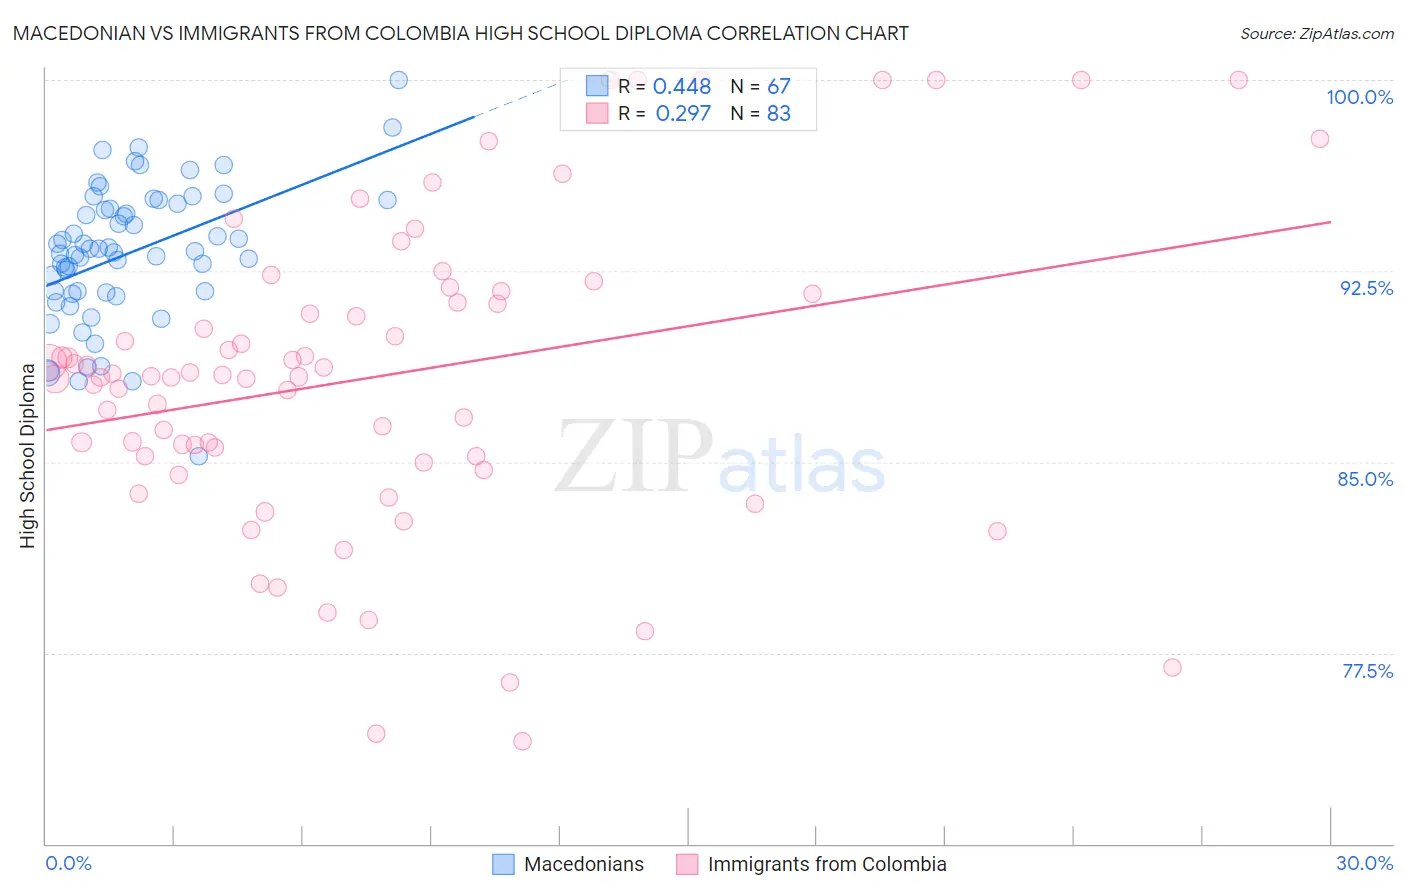
Macedonian vs Immigrants from Colombia High School Diploma Correlation Chart
The statistical analysis conducted on geographies consisting of 132,645,902 people shows a moderate positive correlation between the proportion of Macedonians and percentage of population with at least high school diploma education in the United States with a correlation coefficient (R) of 0.448 and weighted average of 91.1%. Similarly, the statistical analysis conducted on geographies consisting of 378,643,826 people shows a weak positive correlation between the proportion of Immigrants from Colombia and percentage of population with at least high school diploma education in the United States with a correlation coefficient (R) of 0.297 and weighted average of 87.6%, a difference of 4.0%.
High School Diploma Correlation Summary
| Measurement | Macedonian | Immigrants from Colombia |
| Minimum | 85.2% | 74.0% |
| Maximum | 100.0% | 100.0% |
| Range | 14.8% | 26.0% |
| Mean | 93.2% | 88.4% |
| Median | 93.3% | 88.4% |
| Interquartile 25% (IQ1) | 91.7% | 85.2% |
| Interquartile 75% (IQ3) | 95.1% | 91.6% |
| Interquartile Range (IQR) | 3.5% | 6.4% |
| Standard Deviation (Sample) | 2.7% | 6.0% |
| Standard Deviation (Population) | 2.7% | 6.0% |
Similar Demographics by High School Diploma
Demographics Similar to Macedonians by High School Diploma
In terms of high school diploma, the demographic groups most similar to Macedonians are Serbian (91.1%, a difference of 0.010%), New Zealander (91.1%, a difference of 0.020%), Immigrants from Sweden (91.1%, a difference of 0.020%), Immigrants from Belgium (91.1%, a difference of 0.020%), and Immigrants from Canada (91.1%, a difference of 0.040%).
| Demographics | Rating | Rank | High School Diploma |
| Australians | 99.8 /100 | #47 | Exceptional 91.2% |
| Belgians | 99.8 /100 | #48 | Exceptional 91.2% |
| Bhutanese | 99.8 /100 | #49 | Exceptional 91.2% |
| Welsh | 99.8 /100 | #50 | Exceptional 91.2% |
| New Zealanders | 99.7 /100 | #51 | Exceptional 91.1% |
| Immigrants | Sweden | 99.7 /100 | #52 | Exceptional 91.1% |
| Immigrants | Belgium | 99.7 /100 | #53 | Exceptional 91.1% |
| Macedonians | 99.7 /100 | #54 | Exceptional 91.1% |
| Serbians | 99.7 /100 | #55 | Exceptional 91.1% |
| Immigrants | Canada | 99.7 /100 | #56 | Exceptional 91.1% |
| Zimbabweans | 99.7 /100 | #57 | Exceptional 91.1% |
| Slavs | 99.7 /100 | #58 | Exceptional 91.0% |
| Immigrants | North America | 99.7 /100 | #59 | Exceptional 91.0% |
| Immigrants | Japan | 99.6 /100 | #60 | Exceptional 91.0% |
| Immigrants | Taiwan | 99.6 /100 | #61 | Exceptional 91.0% |
Demographics Similar to Immigrants from Colombia by High School Diploma
In terms of high school diploma, the demographic groups most similar to Immigrants from Colombia are Immigrants from Uruguay (87.6%, a difference of 0.010%), Immigrants from South America (87.6%, a difference of 0.050%), Immigrants from Senegal (87.6%, a difference of 0.060%), Ghanaian (87.7%, a difference of 0.12%), and Spanish American (87.7%, a difference of 0.16%).
| Demographics | Rating | Rank | High School Diploma |
| Immigrants | Costa Rica | 1.7 /100 | #247 | Tragic 87.8% |
| Spanish Americans | 1.5 /100 | #248 | Tragic 87.7% |
| Senegalese | 1.5 /100 | #249 | Tragic 87.7% |
| Immigrants | Nigeria | 1.5 /100 | #250 | Tragic 87.7% |
| Ghanaians | 1.4 /100 | #251 | Tragic 87.7% |
| Immigrants | South America | 1.2 /100 | #252 | Tragic 87.6% |
| Immigrants | Uruguay | 1.0 /100 | #253 | Tragic 87.6% |
| Immigrants | Colombia | 1.0 /100 | #254 | Tragic 87.6% |
| Immigrants | Senegal | 0.9 /100 | #255 | Tragic 87.6% |
| Africans | 0.7 /100 | #256 | Tragic 87.5% |
| Bahamians | 0.7 /100 | #257 | Tragic 87.5% |
| Immigrants | Ghana | 0.5 /100 | #258 | Tragic 87.4% |
| Immigrants | Western Africa | 0.5 /100 | #259 | Tragic 87.4% |
| Cajuns | 0.4 /100 | #260 | Tragic 87.3% |
| Seminole | 0.4 /100 | #261 | Tragic 87.3% |