Macedonian vs Immigrants from Colombia Unemployment Among Women with Children Under 6 years
COMPARE
Macedonian
Immigrants from Colombia
Unemployment Among Women with Children Under 6 years
Unemployment Among Women with Children Under 6 years Comparison
Macedonians
Immigrants from Colombia
7.2%
UNEMPLOYMENT AMONG WOMEN WITH CHILDREN UNDER 6 YEARS
97.7/ 100
METRIC RATING
94th/ 347
METRIC RANK
7.4%
UNEMPLOYMENT AMONG WOMEN WITH CHILDREN UNDER 6 YEARS
83.9/ 100
METRIC RATING
139th/ 347
METRIC RANK
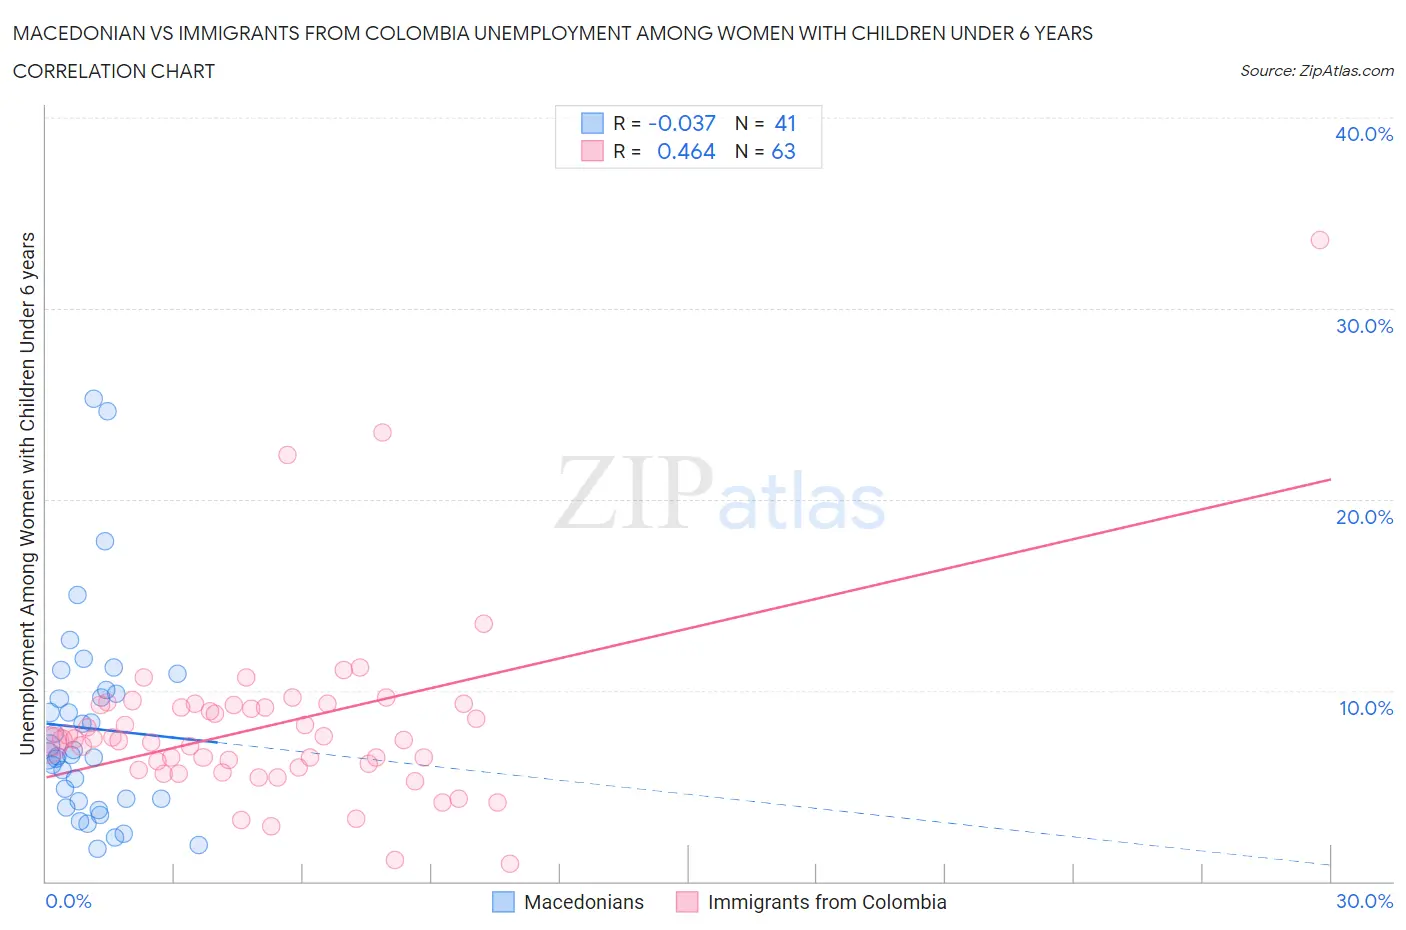
Macedonian vs Immigrants from Colombia Unemployment Among Women with Children Under 6 years Correlation Chart
The statistical analysis conducted on geographies consisting of 112,540,852 people shows no correlation between the proportion of Macedonians and unemployment rate among women with children under the age of 6 in the United States with a correlation coefficient (R) of -0.037 and weighted average of 7.2%. Similarly, the statistical analysis conducted on geographies consisting of 294,204,516 people shows a moderate positive correlation between the proportion of Immigrants from Colombia and unemployment rate among women with children under the age of 6 in the United States with a correlation coefficient (R) of 0.464 and weighted average of 7.4%, a difference of 3.7%.
Unemployment Among Women with Children Under 6 years Correlation Summary
| Measurement | Macedonian | Immigrants from Colombia |
| Minimum | 1.7% | 0.90% |
| Maximum | 25.3% | 33.6% |
| Range | 23.6% | 32.7% |
| Mean | 8.0% | 8.2% |
| Median | 6.6% | 7.4% |
| Interquartile 25% (IQ1) | 4.3% | 5.9% |
| Interquartile 75% (IQ3) | 9.9% | 9.2% |
| Interquartile Range (IQR) | 5.6% | 3.3% |
| Standard Deviation (Sample) | 5.3% | 4.9% |
| Standard Deviation (Population) | 5.2% | 4.8% |
Similar Demographics by Unemployment Among Women with Children Under 6 years
Demographics Similar to Macedonians by Unemployment Among Women with Children Under 6 years
In terms of unemployment among women with children under 6 years, the demographic groups most similar to Macedonians are Romanian (7.2%, a difference of 0.040%), Immigrants from Eastern Africa (7.2%, a difference of 0.060%), New Zealander (7.2%, a difference of 0.070%), Immigrants from South Eastern Asia (7.2%, a difference of 0.13%), and Russian (7.2%, a difference of 0.17%).
| Demographics | Rating | Rank | Unemployment Among Women with Children Under 6 years |
| Alsatians | 98.4 /100 | #87 | Exceptional 7.1% |
| Immigrants | Hungary | 98.3 /100 | #88 | Exceptional 7.1% |
| Immigrants | Denmark | 98.3 /100 | #89 | Exceptional 7.1% |
| Immigrants | Spain | 98.2 /100 | #90 | Exceptional 7.1% |
| Danes | 98.2 /100 | #91 | Exceptional 7.1% |
| Albanians | 98.0 /100 | #92 | Exceptional 7.2% |
| New Zealanders | 97.8 /100 | #93 | Exceptional 7.2% |
| Macedonians | 97.7 /100 | #94 | Exceptional 7.2% |
| Romanians | 97.7 /100 | #95 | Exceptional 7.2% |
| Immigrants | Eastern Africa | 97.7 /100 | #96 | Exceptional 7.2% |
| Immigrants | South Eastern Asia | 97.6 /100 | #97 | Exceptional 7.2% |
| Russians | 97.5 /100 | #98 | Exceptional 7.2% |
| Immigrants | Europe | 97.5 /100 | #99 | Exceptional 7.2% |
| Immigrants | Northern Europe | 97.4 /100 | #100 | Exceptional 7.2% |
| Chileans | 97.4 /100 | #101 | Exceptional 7.2% |
Demographics Similar to Immigrants from Colombia by Unemployment Among Women with Children Under 6 years
In terms of unemployment among women with children under 6 years, the demographic groups most similar to Immigrants from Colombia are Immigrants from Norway (7.4%, a difference of 0.020%), Immigrants from Cambodia (7.4%, a difference of 0.090%), Scandinavian (7.4%, a difference of 0.11%), Immigrants from Morocco (7.4%, a difference of 0.13%), and Greek (7.4%, a difference of 0.16%).
| Demographics | Rating | Rank | Unemployment Among Women with Children Under 6 years |
| Immigrants | Armenia | 87.4 /100 | #132 | Excellent 7.4% |
| Immigrants | Uganda | 86.5 /100 | #133 | Excellent 7.4% |
| Immigrants | Bolivia | 85.7 /100 | #134 | Excellent 7.4% |
| Immigrants | Northern Africa | 85.3 /100 | #135 | Excellent 7.4% |
| Immigrants | Morocco | 84.9 /100 | #136 | Excellent 7.4% |
| Immigrants | Cambodia | 84.6 /100 | #137 | Excellent 7.4% |
| Immigrants | Norway | 84.1 /100 | #138 | Excellent 7.4% |
| Immigrants | Colombia | 83.9 /100 | #139 | Excellent 7.4% |
| Scandinavians | 83.0 /100 | #140 | Excellent 7.4% |
| Greeks | 82.6 /100 | #141 | Excellent 7.4% |
| Immigrants | Argentina | 81.5 /100 | #142 | Excellent 7.5% |
| Koreans | 81.3 /100 | #143 | Excellent 7.5% |
| Europeans | 79.1 /100 | #144 | Good 7.5% |
| Immigrants | Jordan | 78.9 /100 | #145 | Good 7.5% |
| Japanese | 78.9 /100 | #146 | Good 7.5% |