French vs Immigrants from Colombia High School Diploma
COMPARE
French
Immigrants from Colombia
High School Diploma
High School Diploma Comparison
French
Immigrants from Colombia
91.0%
HIGH SCHOOL DIPLOMA
99.5/ 100
METRIC RATING
66th/ 347
METRIC RANK
87.6%
HIGH SCHOOL DIPLOMA
1.0/ 100
METRIC RATING
254th/ 347
METRIC RANK
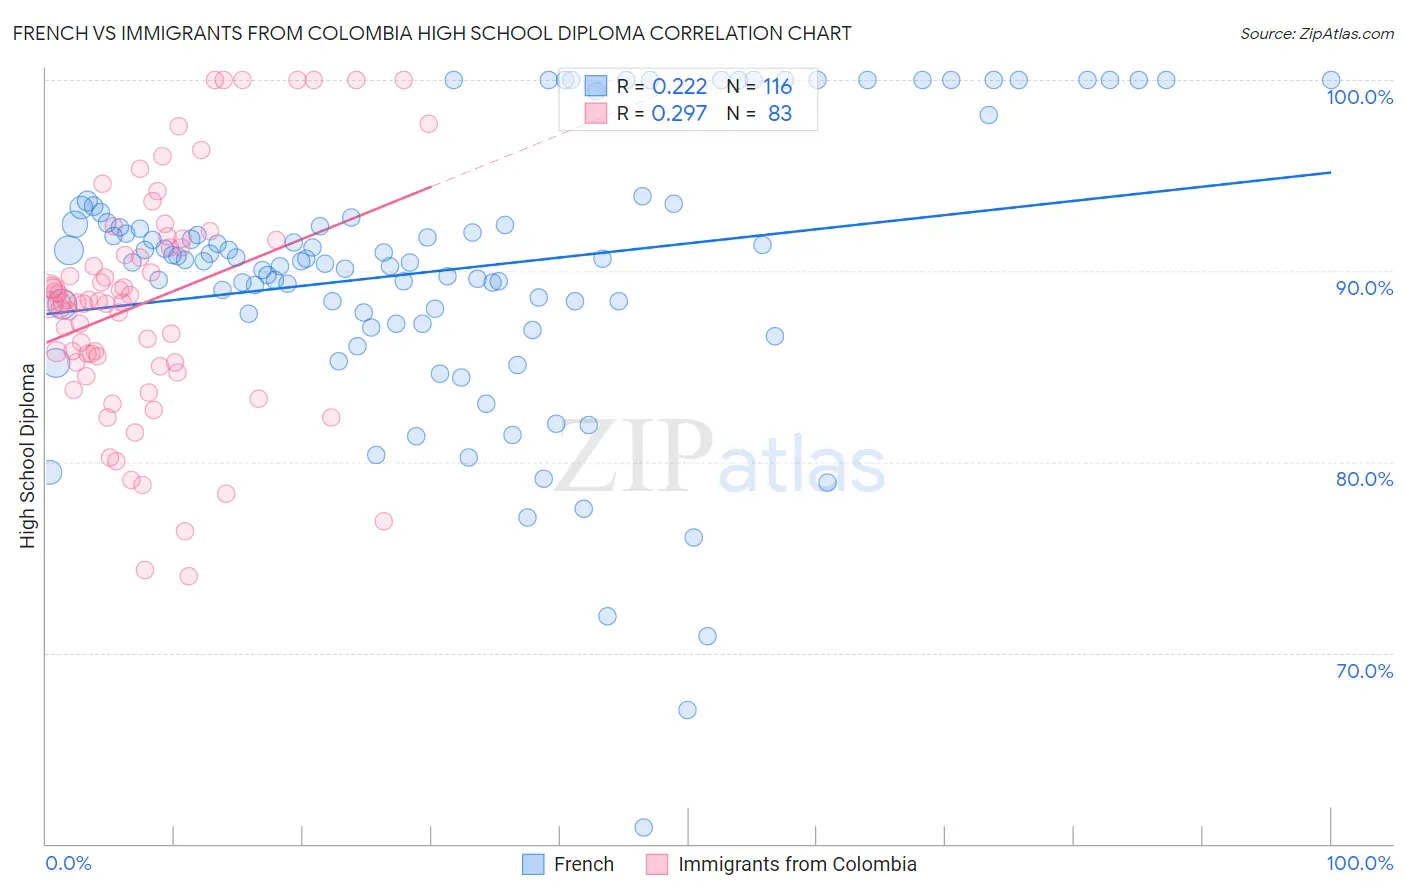
French vs Immigrants from Colombia High School Diploma Correlation Chart
The statistical analysis conducted on geographies consisting of 572,427,361 people shows a weak positive correlation between the proportion of French and percentage of population with at least high school diploma education in the United States with a correlation coefficient (R) of 0.222 and weighted average of 91.0%. Similarly, the statistical analysis conducted on geographies consisting of 378,643,826 people shows a weak positive correlation between the proportion of Immigrants from Colombia and percentage of population with at least high school diploma education in the United States with a correlation coefficient (R) of 0.297 and weighted average of 87.6%, a difference of 3.8%.
High School Diploma Correlation Summary
| Measurement | French | Immigrants from Colombia |
| Minimum | 60.9% | 74.0% |
| Maximum | 100.0% | 100.0% |
| Range | 39.1% | 26.0% |
| Mean | 90.1% | 88.4% |
| Median | 90.6% | 88.4% |
| Interquartile 25% (IQ1) | 87.8% | 85.2% |
| Interquartile 75% (IQ3) | 92.9% | 91.6% |
| Interquartile Range (IQR) | 5.1% | 6.4% |
| Standard Deviation (Sample) | 7.3% | 6.0% |
| Standard Deviation (Population) | 7.2% | 6.0% |
Similar Demographics by High School Diploma
Demographics Similar to French by High School Diploma
In terms of high school diploma, the demographic groups most similar to French are Ukrainian (91.0%, a difference of 0.010%), Immigrants from South Africa (91.0%, a difference of 0.010%), Immigrants from Netherlands (91.0%, a difference of 0.020%), Immigrants from Iran (90.9%, a difference of 0.020%), and Czechoslovakian (90.9%, a difference of 0.030%).
| Demographics | Rating | Rank | High School Diploma |
| Immigrants | North America | 99.7 /100 | #59 | Exceptional 91.0% |
| Immigrants | Japan | 99.6 /100 | #60 | Exceptional 91.0% |
| Immigrants | Taiwan | 99.6 /100 | #61 | Exceptional 91.0% |
| Austrians | 99.6 /100 | #62 | Exceptional 91.0% |
| Immigrants | Netherlands | 99.6 /100 | #63 | Exceptional 91.0% |
| Ukrainians | 99.6 /100 | #64 | Exceptional 91.0% |
| Immigrants | South Africa | 99.6 /100 | #65 | Exceptional 91.0% |
| French | 99.5 /100 | #66 | Exceptional 91.0% |
| Immigrants | Iran | 99.5 /100 | #67 | Exceptional 90.9% |
| Czechoslovakians | 99.5 /100 | #68 | Exceptional 90.9% |
| French Canadians | 99.5 /100 | #69 | Exceptional 90.9% |
| Immigrants | Latvia | 99.5 /100 | #70 | Exceptional 90.9% |
| Alaskan Athabascans | 99.4 /100 | #71 | Exceptional 90.9% |
| Soviet Union | 99.4 /100 | #72 | Exceptional 90.9% |
| Immigrants | South Central Asia | 99.4 /100 | #73 | Exceptional 90.9% |
Demographics Similar to Immigrants from Colombia by High School Diploma
In terms of high school diploma, the demographic groups most similar to Immigrants from Colombia are Immigrants from Uruguay (87.6%, a difference of 0.010%), Immigrants from South America (87.6%, a difference of 0.050%), Immigrants from Senegal (87.6%, a difference of 0.060%), Ghanaian (87.7%, a difference of 0.12%), and Spanish American (87.7%, a difference of 0.16%).
| Demographics | Rating | Rank | High School Diploma |
| Immigrants | Costa Rica | 1.7 /100 | #247 | Tragic 87.8% |
| Spanish Americans | 1.5 /100 | #248 | Tragic 87.7% |
| Senegalese | 1.5 /100 | #249 | Tragic 87.7% |
| Immigrants | Nigeria | 1.5 /100 | #250 | Tragic 87.7% |
| Ghanaians | 1.4 /100 | #251 | Tragic 87.7% |
| Immigrants | South America | 1.2 /100 | #252 | Tragic 87.6% |
| Immigrants | Uruguay | 1.0 /100 | #253 | Tragic 87.6% |
| Immigrants | Colombia | 1.0 /100 | #254 | Tragic 87.6% |
| Immigrants | Senegal | 0.9 /100 | #255 | Tragic 87.6% |
| Africans | 0.7 /100 | #256 | Tragic 87.5% |
| Bahamians | 0.7 /100 | #257 | Tragic 87.5% |
| Immigrants | Ghana | 0.5 /100 | #258 | Tragic 87.4% |
| Immigrants | Western Africa | 0.5 /100 | #259 | Tragic 87.4% |
| Cajuns | 0.4 /100 | #260 | Tragic 87.3% |
| Seminole | 0.4 /100 | #261 | Tragic 87.3% |