Fijian vs Immigrants from Colombia High School Diploma
COMPARE
Fijian
Immigrants from Colombia
High School Diploma
High School Diploma Comparison
Fijians
Immigrants from Colombia
86.0%
HIGH SCHOOL DIPLOMA
0.0/ 100
METRIC RATING
290th/ 347
METRIC RANK
87.6%
HIGH SCHOOL DIPLOMA
1.0/ 100
METRIC RATING
254th/ 347
METRIC RANK
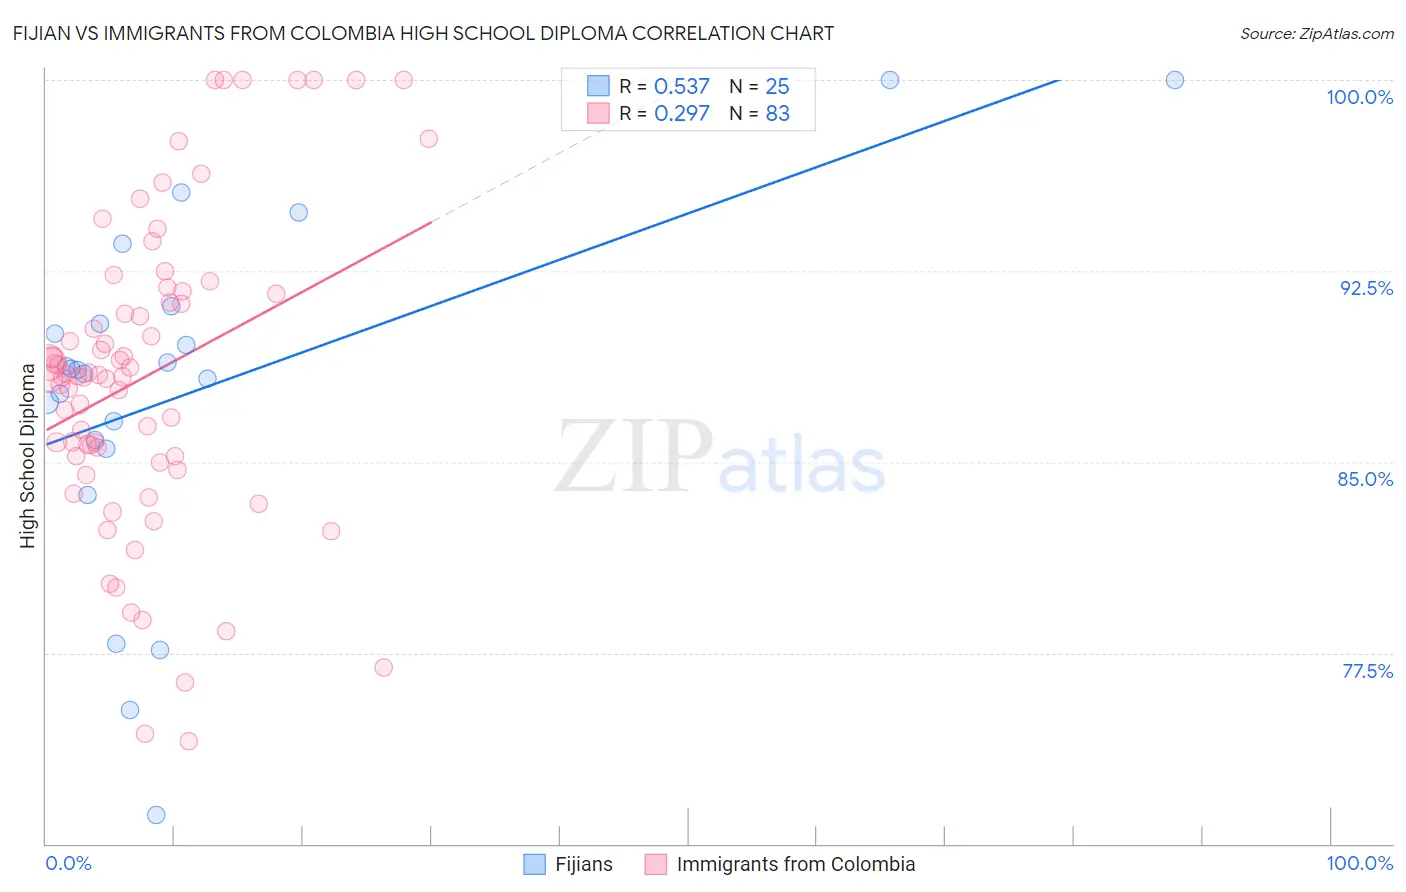
Fijian vs Immigrants from Colombia High School Diploma Correlation Chart
The statistical analysis conducted on geographies consisting of 55,948,842 people shows a substantial positive correlation between the proportion of Fijians and percentage of population with at least high school diploma education in the United States with a correlation coefficient (R) of 0.537 and weighted average of 86.0%. Similarly, the statistical analysis conducted on geographies consisting of 378,643,826 people shows a weak positive correlation between the proportion of Immigrants from Colombia and percentage of population with at least high school diploma education in the United States with a correlation coefficient (R) of 0.297 and weighted average of 87.6%, a difference of 1.9%.
High School Diploma Correlation Summary
| Measurement | Fijian | Immigrants from Colombia |
| Minimum | 71.1% | 74.0% |
| Maximum | 100.0% | 100.0% |
| Range | 28.9% | 26.0% |
| Mean | 87.8% | 88.4% |
| Median | 88.6% | 88.4% |
| Interquartile 25% (IQ1) | 85.7% | 85.2% |
| Interquartile 75% (IQ3) | 90.8% | 91.6% |
| Interquartile Range (IQR) | 5.1% | 6.4% |
| Standard Deviation (Sample) | 6.9% | 6.0% |
| Standard Deviation (Population) | 6.7% | 6.0% |
Similar Demographics by High School Diploma
Demographics Similar to Fijians by High School Diploma
In terms of high school diploma, the demographic groups most similar to Fijians are Yup'ik (86.1%, a difference of 0.070%), Haitian (85.9%, a difference of 0.13%), Japanese (85.9%, a difference of 0.14%), British West Indian (85.9%, a difference of 0.16%), and Ute (86.2%, a difference of 0.18%).
| Demographics | Rating | Rank | High School Diploma |
| Immigrants | Barbados | 0.0 /100 | #283 | Tragic 86.4% |
| Paiute | 0.0 /100 | #284 | Tragic 86.4% |
| Immigrants | West Indies | 0.0 /100 | #285 | Tragic 86.2% |
| Immigrants | St. Vincent and the Grenadines | 0.0 /100 | #286 | Tragic 86.2% |
| Ute | 0.0 /100 | #287 | Tragic 86.2% |
| Immigrants | Vietnam | 0.0 /100 | #288 | Tragic 86.2% |
| Yup'ik | 0.0 /100 | #289 | Tragic 86.1% |
| Fijians | 0.0 /100 | #290 | Tragic 86.0% |
| Haitians | 0.0 /100 | #291 | Tragic 85.9% |
| Japanese | 0.0 /100 | #292 | Tragic 85.9% |
| British West Indians | 0.0 /100 | #293 | Tragic 85.9% |
| Immigrants | Fiji | 0.0 /100 | #294 | Tragic 85.8% |
| Immigrants | Immigrants | 0.0 /100 | #295 | Tragic 85.8% |
| Immigrants | Cambodia | 0.0 /100 | #296 | Tragic 85.6% |
| Immigrants | Grenada | 0.0 /100 | #297 | Tragic 85.6% |
Demographics Similar to Immigrants from Colombia by High School Diploma
In terms of high school diploma, the demographic groups most similar to Immigrants from Colombia are Immigrants from Uruguay (87.6%, a difference of 0.010%), Immigrants from South America (87.6%, a difference of 0.050%), Immigrants from Senegal (87.6%, a difference of 0.060%), Ghanaian (87.7%, a difference of 0.12%), and Spanish American (87.7%, a difference of 0.16%).
| Demographics | Rating | Rank | High School Diploma |
| Immigrants | Costa Rica | 1.7 /100 | #247 | Tragic 87.8% |
| Spanish Americans | 1.5 /100 | #248 | Tragic 87.7% |
| Senegalese | 1.5 /100 | #249 | Tragic 87.7% |
| Immigrants | Nigeria | 1.5 /100 | #250 | Tragic 87.7% |
| Ghanaians | 1.4 /100 | #251 | Tragic 87.7% |
| Immigrants | South America | 1.2 /100 | #252 | Tragic 87.6% |
| Immigrants | Uruguay | 1.0 /100 | #253 | Tragic 87.6% |
| Immigrants | Colombia | 1.0 /100 | #254 | Tragic 87.6% |
| Immigrants | Senegal | 0.9 /100 | #255 | Tragic 87.6% |
| Africans | 0.7 /100 | #256 | Tragic 87.5% |
| Bahamians | 0.7 /100 | #257 | Tragic 87.5% |
| Immigrants | Ghana | 0.5 /100 | #258 | Tragic 87.4% |
| Immigrants | Western Africa | 0.5 /100 | #259 | Tragic 87.4% |
| Cajuns | 0.4 /100 | #260 | Tragic 87.3% |
| Seminole | 0.4 /100 | #261 | Tragic 87.3% |