Somali vs Immigrants from Colombia High School Diploma
COMPARE
Somali
Immigrants from Colombia
High School Diploma
High School Diploma Comparison
Somalis
Immigrants from Colombia
88.6%
HIGH SCHOOL DIPLOMA
17.5/ 100
METRIC RATING
203rd/ 347
METRIC RANK
87.6%
HIGH SCHOOL DIPLOMA
1.0/ 100
METRIC RATING
254th/ 347
METRIC RANK
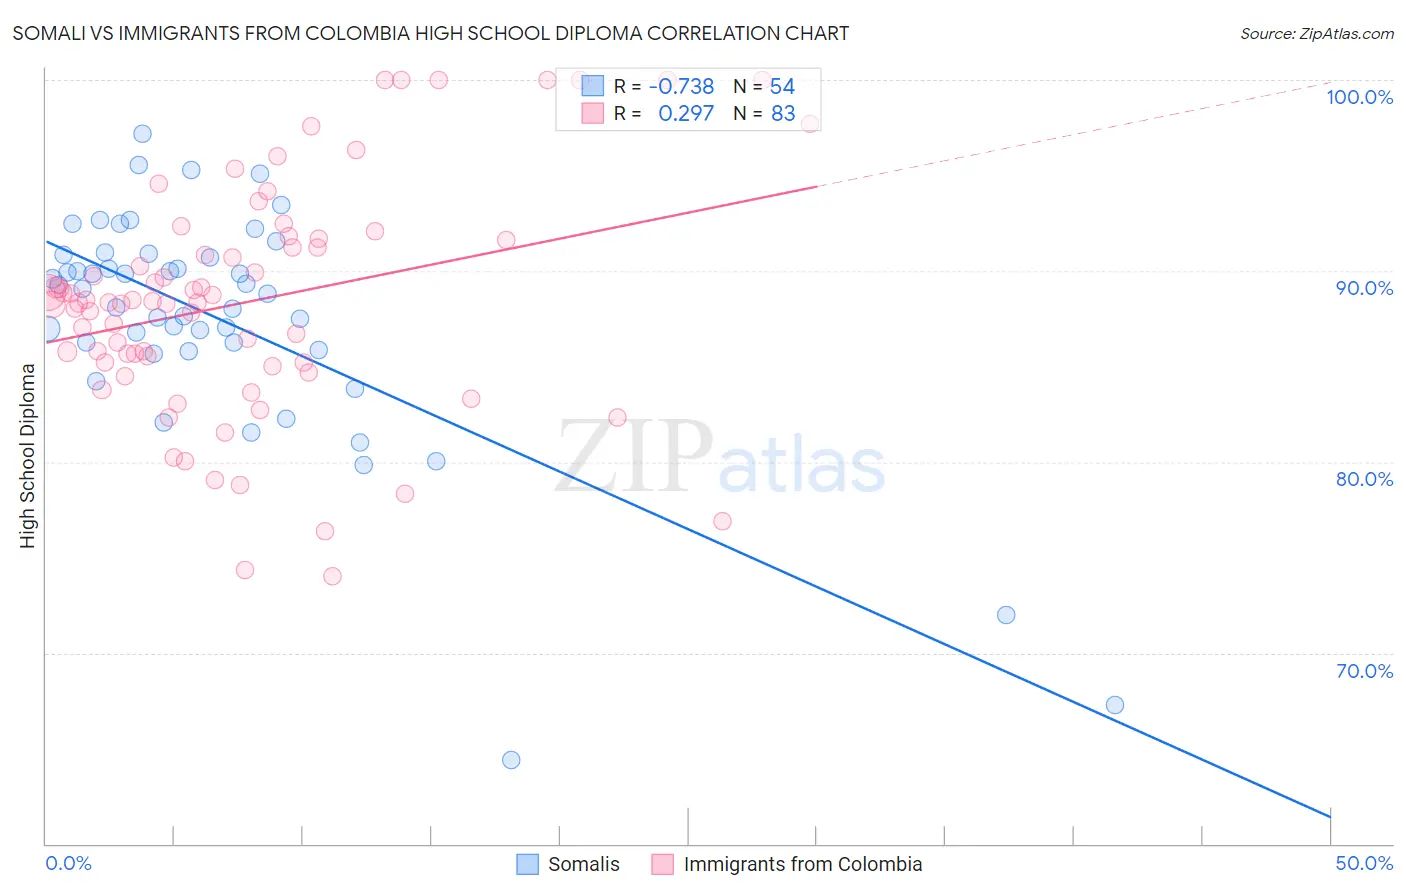
Somali vs Immigrants from Colombia High School Diploma Correlation Chart
The statistical analysis conducted on geographies consisting of 99,332,457 people shows a strong negative correlation between the proportion of Somalis and percentage of population with at least high school diploma education in the United States with a correlation coefficient (R) of -0.738 and weighted average of 88.6%. Similarly, the statistical analysis conducted on geographies consisting of 378,643,826 people shows a weak positive correlation between the proportion of Immigrants from Colombia and percentage of population with at least high school diploma education in the United States with a correlation coefficient (R) of 0.297 and weighted average of 87.6%, a difference of 1.2%.
High School Diploma Correlation Summary
| Measurement | Somali | Immigrants from Colombia |
| Minimum | 64.4% | 74.0% |
| Maximum | 97.2% | 100.0% |
| Range | 32.8% | 26.0% |
| Mean | 87.4% | 88.4% |
| Median | 88.9% | 88.4% |
| Interquartile 25% (IQ1) | 85.9% | 85.2% |
| Interquartile 75% (IQ3) | 90.9% | 91.6% |
| Interquartile Range (IQR) | 5.0% | 6.4% |
| Standard Deviation (Sample) | 6.2% | 6.0% |
| Standard Deviation (Population) | 6.1% | 6.0% |
Similar Demographics by High School Diploma
Demographics Similar to Somalis by High School Diploma
In terms of high school diploma, the demographic groups most similar to Somalis are Panamanian (88.6%, a difference of 0.010%), Armenian (88.6%, a difference of 0.010%), Hawaiian (88.6%, a difference of 0.020%), Korean (88.6%, a difference of 0.020%), and Liberian (88.7%, a difference of 0.030%).
| Demographics | Rating | Rank | High School Diploma |
| Immigrants | Southern Europe | 23.4 /100 | #196 | Fair 88.7% |
| French American Indians | 21.5 /100 | #197 | Fair 88.7% |
| Liberians | 18.8 /100 | #198 | Poor 88.7% |
| Marshallese | 18.7 /100 | #199 | Poor 88.6% |
| Hawaiians | 18.3 /100 | #200 | Poor 88.6% |
| Koreans | 18.1 /100 | #201 | Poor 88.6% |
| Panamanians | 18.0 /100 | #202 | Poor 88.6% |
| Somalis | 17.5 /100 | #203 | Poor 88.6% |
| Armenians | 17.2 /100 | #204 | Poor 88.6% |
| Immigrants | Micronesia | 16.4 /100 | #205 | Poor 88.6% |
| Arapaho | 16.1 /100 | #206 | Poor 88.6% |
| Immigrants | Sierra Leone | 15.8 /100 | #207 | Poor 88.6% |
| Portuguese | 14.4 /100 | #208 | Poor 88.5% |
| Cherokee | 14.3 /100 | #209 | Poor 88.5% |
| Samoans | 14.0 /100 | #210 | Poor 88.5% |
Demographics Similar to Immigrants from Colombia by High School Diploma
In terms of high school diploma, the demographic groups most similar to Immigrants from Colombia are Immigrants from Uruguay (87.6%, a difference of 0.010%), Immigrants from South America (87.6%, a difference of 0.050%), Immigrants from Senegal (87.6%, a difference of 0.060%), Ghanaian (87.7%, a difference of 0.12%), and Spanish American (87.7%, a difference of 0.16%).
| Demographics | Rating | Rank | High School Diploma |
| Immigrants | Costa Rica | 1.7 /100 | #247 | Tragic 87.8% |
| Spanish Americans | 1.5 /100 | #248 | Tragic 87.7% |
| Senegalese | 1.5 /100 | #249 | Tragic 87.7% |
| Immigrants | Nigeria | 1.5 /100 | #250 | Tragic 87.7% |
| Ghanaians | 1.4 /100 | #251 | Tragic 87.7% |
| Immigrants | South America | 1.2 /100 | #252 | Tragic 87.6% |
| Immigrants | Uruguay | 1.0 /100 | #253 | Tragic 87.6% |
| Immigrants | Colombia | 1.0 /100 | #254 | Tragic 87.6% |
| Immigrants | Senegal | 0.9 /100 | #255 | Tragic 87.6% |
| Africans | 0.7 /100 | #256 | Tragic 87.5% |
| Bahamians | 0.7 /100 | #257 | Tragic 87.5% |
| Immigrants | Ghana | 0.5 /100 | #258 | Tragic 87.4% |
| Immigrants | Western Africa | 0.5 /100 | #259 | Tragic 87.4% |
| Cajuns | 0.4 /100 | #260 | Tragic 87.3% |
| Seminole | 0.4 /100 | #261 | Tragic 87.3% |