Macedonian vs Immigrants from Scotland High School Diploma
COMPARE
Macedonian
Immigrants from Scotland
High School Diploma
High School Diploma Comparison
Macedonians
Immigrants from Scotland
91.1%
HIGH SCHOOL DIPLOMA
99.7/ 100
METRIC RATING
54th/ 347
METRIC RANK
91.3%
HIGH SCHOOL DIPLOMA
99.8/ 100
METRIC RATING
38th/ 347
METRIC RANK
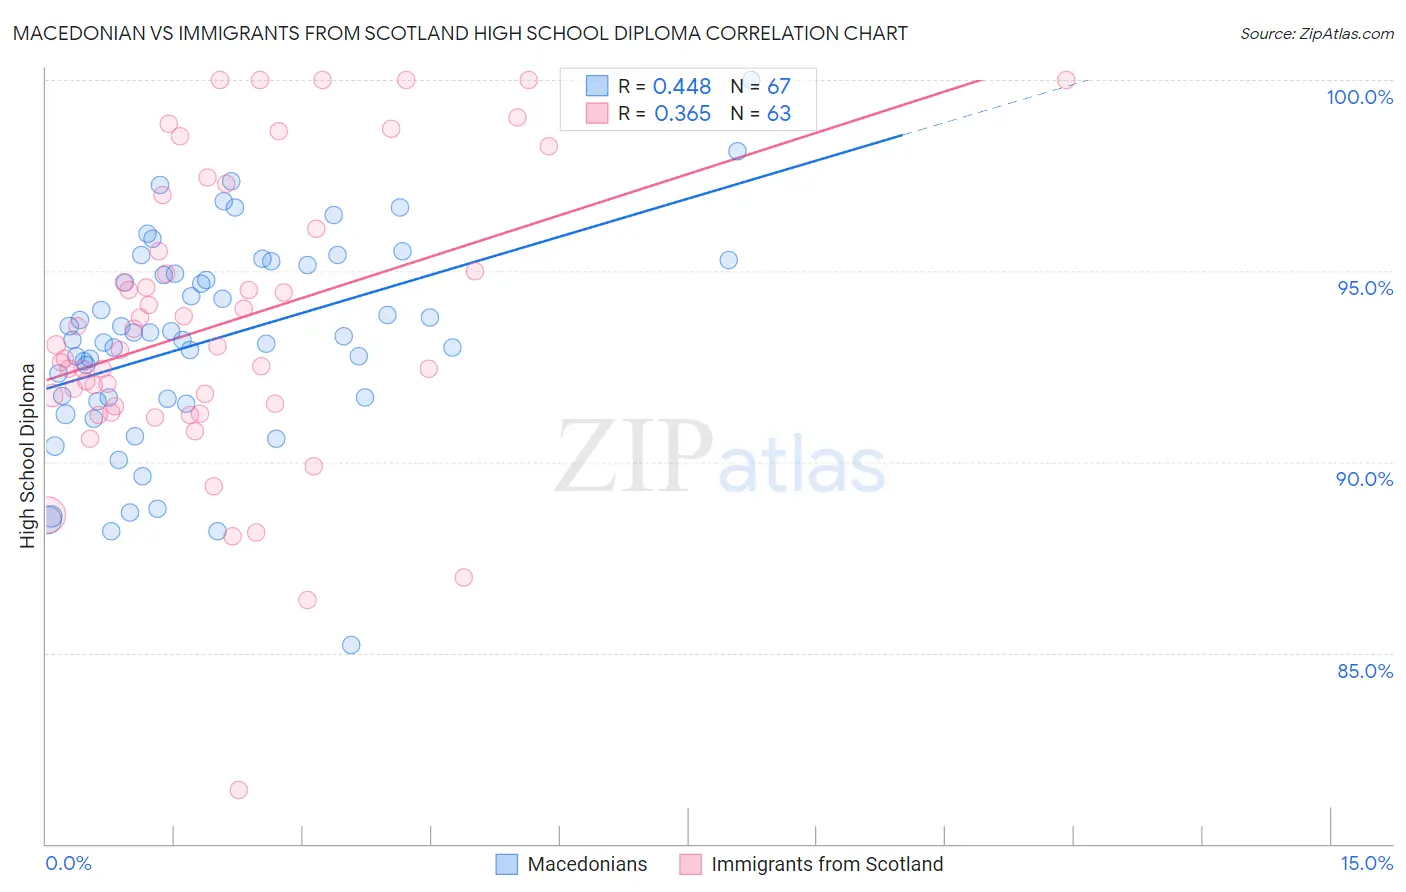
Macedonian vs Immigrants from Scotland High School Diploma Correlation Chart
The statistical analysis conducted on geographies consisting of 132,645,902 people shows a moderate positive correlation between the proportion of Macedonians and percentage of population with at least high school diploma education in the United States with a correlation coefficient (R) of 0.448 and weighted average of 91.1%. Similarly, the statistical analysis conducted on geographies consisting of 196,397,786 people shows a mild positive correlation between the proportion of Immigrants from Scotland and percentage of population with at least high school diploma education in the United States with a correlation coefficient (R) of 0.365 and weighted average of 91.3%, a difference of 0.22%.
High School Diploma Correlation Summary
| Measurement | Macedonian | Immigrants from Scotland |
| Minimum | 85.2% | 81.4% |
| Maximum | 100.0% | 100.0% |
| Range | 14.8% | 18.6% |
| Mean | 93.2% | 93.6% |
| Median | 93.3% | 93.0% |
| Interquartile 25% (IQ1) | 91.7% | 91.4% |
| Interquartile 75% (IQ3) | 95.1% | 96.1% |
| Interquartile Range (IQR) | 3.5% | 4.7% |
| Standard Deviation (Sample) | 2.7% | 3.8% |
| Standard Deviation (Population) | 2.7% | 3.8% |
Demographics Similar to Macedonians and Immigrants from Scotland by High School Diploma
In terms of high school diploma, the demographic groups most similar to Macedonians are Serbian (91.1%, a difference of 0.010%), New Zealander (91.1%, a difference of 0.020%), Immigrants from Sweden (91.1%, a difference of 0.020%), Immigrants from Belgium (91.1%, a difference of 0.020%), and Immigrants from Canada (91.1%, a difference of 0.040%). Similarly, the demographic groups most similar to Immigrants from Scotland are Immigrants from Ireland (91.3%, a difference of 0.020%), Dutch (91.3%, a difference of 0.020%), Immigrants from Lithuania (91.3%, a difference of 0.020%), Tsimshian (91.3%, a difference of 0.040%), and Immigrants from Australia (91.3%, a difference of 0.040%).
| Demographics | Rating | Rank | High School Diploma |
| Tsimshian | 99.9 /100 | #36 | Exceptional 91.3% |
| Immigrants | Ireland | 99.9 /100 | #37 | Exceptional 91.3% |
| Immigrants | Scotland | 99.8 /100 | #38 | Exceptional 91.3% |
| Dutch | 99.8 /100 | #39 | Exceptional 91.3% |
| Immigrants | Lithuania | 99.8 /100 | #40 | Exceptional 91.3% |
| Immigrants | Australia | 99.8 /100 | #41 | Exceptional 91.3% |
| Northern Europeans | 99.8 /100 | #42 | Exceptional 91.3% |
| British | 99.8 /100 | #43 | Exceptional 91.3% |
| Immigrants | Austria | 99.8 /100 | #44 | Exceptional 91.3% |
| Turks | 99.8 /100 | #45 | Exceptional 91.2% |
| Greeks | 99.8 /100 | #46 | Exceptional 91.2% |
| Australians | 99.8 /100 | #47 | Exceptional 91.2% |
| Belgians | 99.8 /100 | #48 | Exceptional 91.2% |
| Bhutanese | 99.8 /100 | #49 | Exceptional 91.2% |
| Welsh | 99.8 /100 | #50 | Exceptional 91.2% |
| New Zealanders | 99.7 /100 | #51 | Exceptional 91.1% |
| Immigrants | Sweden | 99.7 /100 | #52 | Exceptional 91.1% |
| Immigrants | Belgium | 99.7 /100 | #53 | Exceptional 91.1% |
| Macedonians | 99.7 /100 | #54 | Exceptional 91.1% |
| Serbians | 99.7 /100 | #55 | Exceptional 91.1% |
| Immigrants | Canada | 99.7 /100 | #56 | Exceptional 91.1% |