Immigrants from Liberia vs German College, Under 1 year
COMPARE
Immigrants from Liberia
German
College, Under 1 year
College, Under 1 year Comparison
Immigrants from Liberia
Germans
61.9%
COLLEGE, UNDER 1 YEAR
0.8/ 100
METRIC RATING
247th/ 347
METRIC RANK
65.6%
COLLEGE, UNDER 1 YEAR
55.7/ 100
METRIC RATING
170th/ 347
METRIC RANK
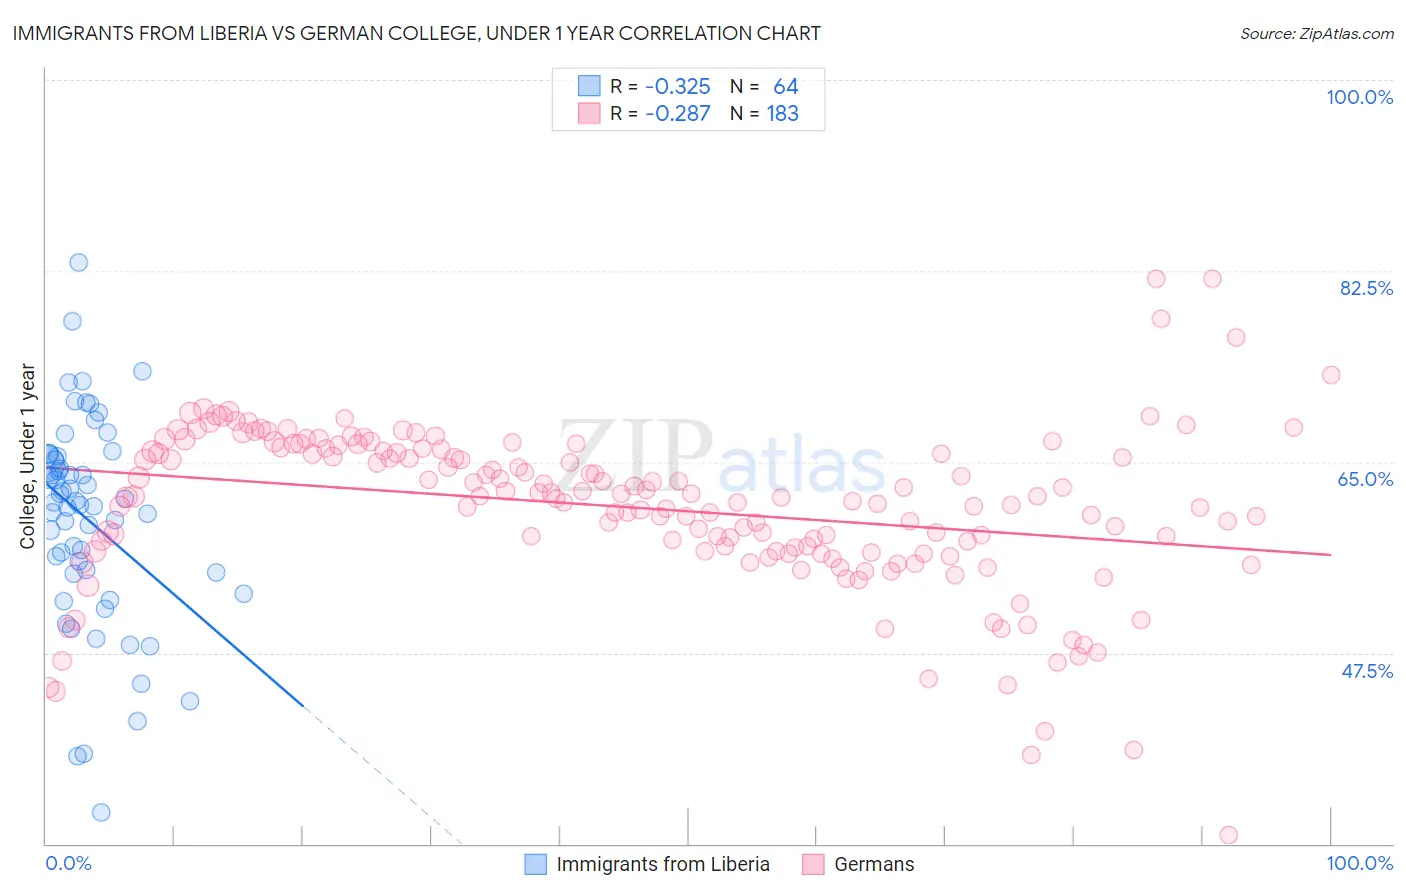
Immigrants from Liberia vs German College, Under 1 year Correlation Chart
The statistical analysis conducted on geographies consisting of 135,295,665 people shows a mild negative correlation between the proportion of Immigrants from Liberia and percentage of population with at least college, under 1 year education in the United States with a correlation coefficient (R) of -0.325 and weighted average of 61.9%. Similarly, the statistical analysis conducted on geographies consisting of 581,283,713 people shows a weak negative correlation between the proportion of Germans and percentage of population with at least college, under 1 year education in the United States with a correlation coefficient (R) of -0.287 and weighted average of 65.6%, a difference of 5.9%.
College, Under 1 year Correlation Summary
| Measurement | Immigrants from Liberia | German |
| Minimum | 32.8% | 30.8% |
| Maximum | 83.3% | 81.8% |
| Range | 50.5% | 51.0% |
| Mean | 59.7% | 60.8% |
| Median | 61.1% | 61.8% |
| Interquartile 25% (IQ1) | 54.8% | 56.8% |
| Interquartile 75% (IQ3) | 65.4% | 66.1% |
| Interquartile Range (IQR) | 10.6% | 9.4% |
| Standard Deviation (Sample) | 9.6% | 7.5% |
| Standard Deviation (Population) | 9.5% | 7.5% |
Similar Demographics by College, Under 1 year
Demographics Similar to Immigrants from Liberia by College, Under 1 year
In terms of college, under 1 year, the demographic groups most similar to Immigrants from Liberia are Marshallese (61.9%, a difference of 0.020%), Potawatomi (61.8%, a difference of 0.23%), Delaware (62.1%, a difference of 0.25%), Colville (62.1%, a difference of 0.31%), and Hawaiian (62.1%, a difference of 0.40%).
| Demographics | Rating | Rank | College, Under 1 year |
| Aleuts | 1.1 /100 | #240 | Tragic 62.2% |
| Ottawa | 1.1 /100 | #241 | Tragic 62.2% |
| Malaysians | 1.1 /100 | #242 | Tragic 62.2% |
| Hawaiians | 1.1 /100 | #243 | Tragic 62.1% |
| Colville | 1.0 /100 | #244 | Tragic 62.1% |
| Delaware | 0.9 /100 | #245 | Tragic 62.1% |
| Marshallese | 0.8 /100 | #246 | Tragic 61.9% |
| Immigrants | Liberia | 0.8 /100 | #247 | Tragic 61.9% |
| Potawatomi | 0.6 /100 | #248 | Tragic 61.8% |
| Vietnamese | 0.5 /100 | #249 | Tragic 61.7% |
| Immigrants | Congo | 0.5 /100 | #250 | Tragic 61.7% |
| Immigrants | Micronesia | 0.5 /100 | #251 | Tragic 61.5% |
| West Indians | 0.4 /100 | #252 | Tragic 61.5% |
| Japanese | 0.4 /100 | #253 | Tragic 61.5% |
| Immigrants | Cambodia | 0.4 /100 | #254 | Tragic 61.5% |
Demographics Similar to Germans by College, Under 1 year
In terms of college, under 1 year, the demographic groups most similar to Germans are Yugoslavian (65.6%, a difference of 0.0%), Hungarian (65.6%, a difference of 0.010%), Immigrants from Somalia (65.6%, a difference of 0.030%), Immigrants from Oceania (65.6%, a difference of 0.030%), and Moroccan (65.6%, a difference of 0.040%).
| Demographics | Rating | Rank | College, Under 1 year |
| Somalis | 62.7 /100 | #163 | Good 65.8% |
| Czechoslovakians | 62.6 /100 | #164 | Good 65.8% |
| Immigrants | Uzbekistan | 61.6 /100 | #165 | Good 65.8% |
| Moroccans | 56.7 /100 | #166 | Average 65.6% |
| Immigrants | Somalia | 56.4 /100 | #167 | Average 65.6% |
| Hungarians | 55.9 /100 | #168 | Average 65.6% |
| Yugoslavians | 55.7 /100 | #169 | Average 65.6% |
| Germans | 55.7 /100 | #170 | Average 65.6% |
| Immigrants | Oceania | 55.0 /100 | #171 | Average 65.6% |
| South American Indians | 54.4 /100 | #172 | Average 65.5% |
| Swiss | 53.9 /100 | #173 | Average 65.5% |
| Immigrants | Bosnia and Herzegovina | 50.0 /100 | #174 | Average 65.4% |
| Scotch-Irish | 49.5 /100 | #175 | Average 65.4% |
| French | 48.9 /100 | #176 | Average 65.4% |
| Immigrants | North Macedonia | 48.6 /100 | #177 | Average 65.4% |