Macedonian vs Indian (Asian) Associate's Degree
COMPARE
Macedonian
Indian (Asian)
Associate's Degree
Associate's Degree Comparison
Macedonians
Indians (Asian)
49.6%
ASSOCIATE'S DEGREE
97.8/ 100
METRIC RATING
99th/ 347
METRIC RANK
54.8%
ASSOCIATE'S DEGREE
100.0/ 100
METRIC RATING
18th/ 347
METRIC RANK
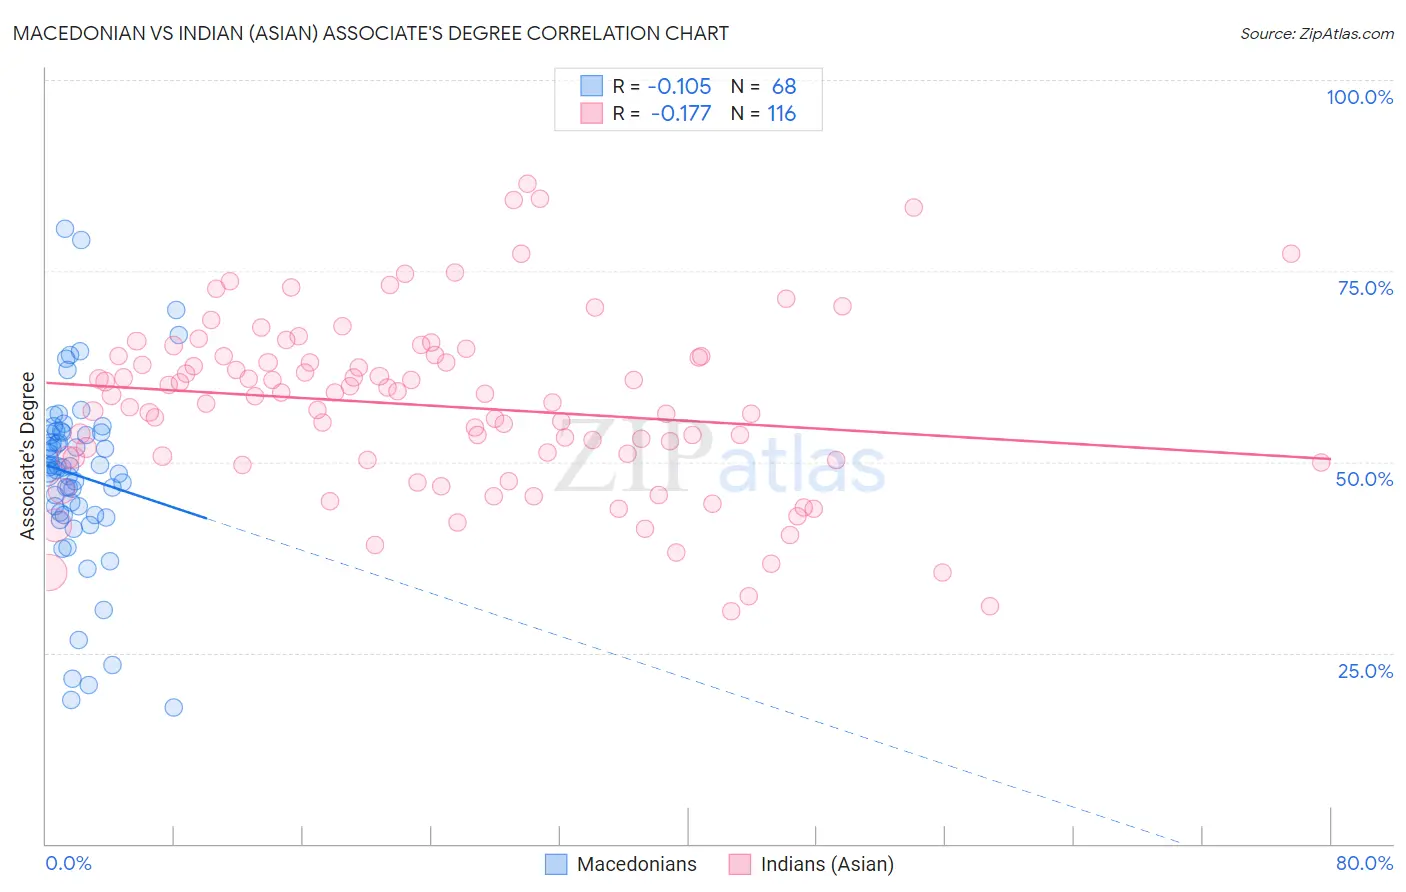
Macedonian vs Indian (Asian) Associate's Degree Correlation Chart
The statistical analysis conducted on geographies consisting of 132,656,097 people shows a poor negative correlation between the proportion of Macedonians and percentage of population with at least associate's degree education in the United States with a correlation coefficient (R) of -0.105 and weighted average of 49.6%. Similarly, the statistical analysis conducted on geographies consisting of 495,274,508 people shows a poor negative correlation between the proportion of Indians (Asian) and percentage of population with at least associate's degree education in the United States with a correlation coefficient (R) of -0.177 and weighted average of 54.8%, a difference of 10.3%.
Associate's Degree Correlation Summary
| Measurement | Macedonian | Indian (Asian) |
| Minimum | 17.8% | 30.4% |
| Maximum | 80.6% | 86.5% |
| Range | 62.7% | 56.1% |
| Mean | 48.2% | 57.3% |
| Median | 49.4% | 58.6% |
| Interquartile 25% (IQ1) | 43.2% | 50.4% |
| Interquartile 75% (IQ3) | 53.9% | 63.9% |
| Interquartile Range (IQR) | 10.6% | 13.4% |
| Standard Deviation (Sample) | 12.1% | 11.5% |
| Standard Deviation (Population) | 12.0% | 11.4% |
Similar Demographics by Associate's Degree
Demographics Similar to Macedonians by Associate's Degree
In terms of associate's degree, the demographic groups most similar to Macedonians are Immigrants from Northern Africa (49.7%, a difference of 0.070%), Romanian (49.7%, a difference of 0.16%), Immigrants from Ukraine (49.7%, a difference of 0.16%), Immigrants from England (49.7%, a difference of 0.18%), and Immigrants from Nepal (49.5%, a difference of 0.22%).
| Demographics | Rating | Rank | Associate's Degree |
| Immigrants | North America | 98.7 /100 | #92 | Exceptional 50.1% |
| Immigrants | Brazil | 98.5 /100 | #93 | Exceptional 50.0% |
| Laotians | 98.4 /100 | #94 | Exceptional 49.9% |
| Immigrants | England | 98.0 /100 | #95 | Exceptional 49.7% |
| Romanians | 98.0 /100 | #96 | Exceptional 49.7% |
| Immigrants | Ukraine | 98.0 /100 | #97 | Exceptional 49.7% |
| Immigrants | Northern Africa | 97.9 /100 | #98 | Exceptional 49.7% |
| Macedonians | 97.8 /100 | #99 | Exceptional 49.6% |
| Immigrants | Nepal | 97.5 /100 | #100 | Exceptional 49.5% |
| Northern Europeans | 97.3 /100 | #101 | Exceptional 49.5% |
| Chileans | 97.3 /100 | #102 | Exceptional 49.4% |
| Ukrainians | 97.1 /100 | #103 | Exceptional 49.4% |
| Venezuelans | 97.0 /100 | #104 | Exceptional 49.4% |
| Croatians | 96.8 /100 | #105 | Exceptional 49.3% |
| Immigrants | Italy | 96.7 /100 | #106 | Exceptional 49.3% |
Demographics Similar to Indians (Asian) by Associate's Degree
In terms of associate's degree, the demographic groups most similar to Indians (Asian) are Immigrants from Ireland (54.7%, a difference of 0.22%), Cambodian (54.6%, a difference of 0.24%), Immigrants from Sweden (54.6%, a difference of 0.31%), Immigrants from Japan (54.6%, a difference of 0.34%), and Burmese (54.6%, a difference of 0.34%).
| Demographics | Rating | Rank | Associate's Degree |
| Immigrants | Australia | 100.0 /100 | #11 | Exceptional 55.8% |
| Immigrants | South Central Asia | 100.0 /100 | #12 | Exceptional 55.7% |
| Immigrants | China | 100.0 /100 | #13 | Exceptional 55.5% |
| Immigrants | Hong Kong | 100.0 /100 | #14 | Exceptional 55.4% |
| Immigrants | Eastern Asia | 100.0 /100 | #15 | Exceptional 55.4% |
| Soviet Union | 100.0 /100 | #16 | Exceptional 55.1% |
| Eastern Europeans | 100.0 /100 | #17 | Exceptional 55.0% |
| Indians (Asian) | 100.0 /100 | #18 | Exceptional 54.8% |
| Immigrants | Ireland | 100.0 /100 | #19 | Exceptional 54.7% |
| Cambodians | 100.0 /100 | #20 | Exceptional 54.6% |
| Immigrants | Sweden | 100.0 /100 | #21 | Exceptional 54.6% |
| Immigrants | Japan | 100.0 /100 | #22 | Exceptional 54.6% |
| Burmese | 100.0 /100 | #23 | Exceptional 54.6% |
| Immigrants | Korea | 100.0 /100 | #24 | Exceptional 54.5% |
| Immigrants | Switzerland | 100.0 /100 | #25 | Exceptional 54.5% |