Macedonian vs Alsatian Associate's Degree
COMPARE
Macedonian
Alsatian
Associate's Degree
Associate's Degree Comparison
Macedonians
Alsatians
49.6%
ASSOCIATE'S DEGREE
97.8/ 100
METRIC RATING
99th/ 347
METRIC RANK
48.8%
ASSOCIATE'S DEGREE
94.6/ 100
METRIC RATING
120th/ 347
METRIC RANK
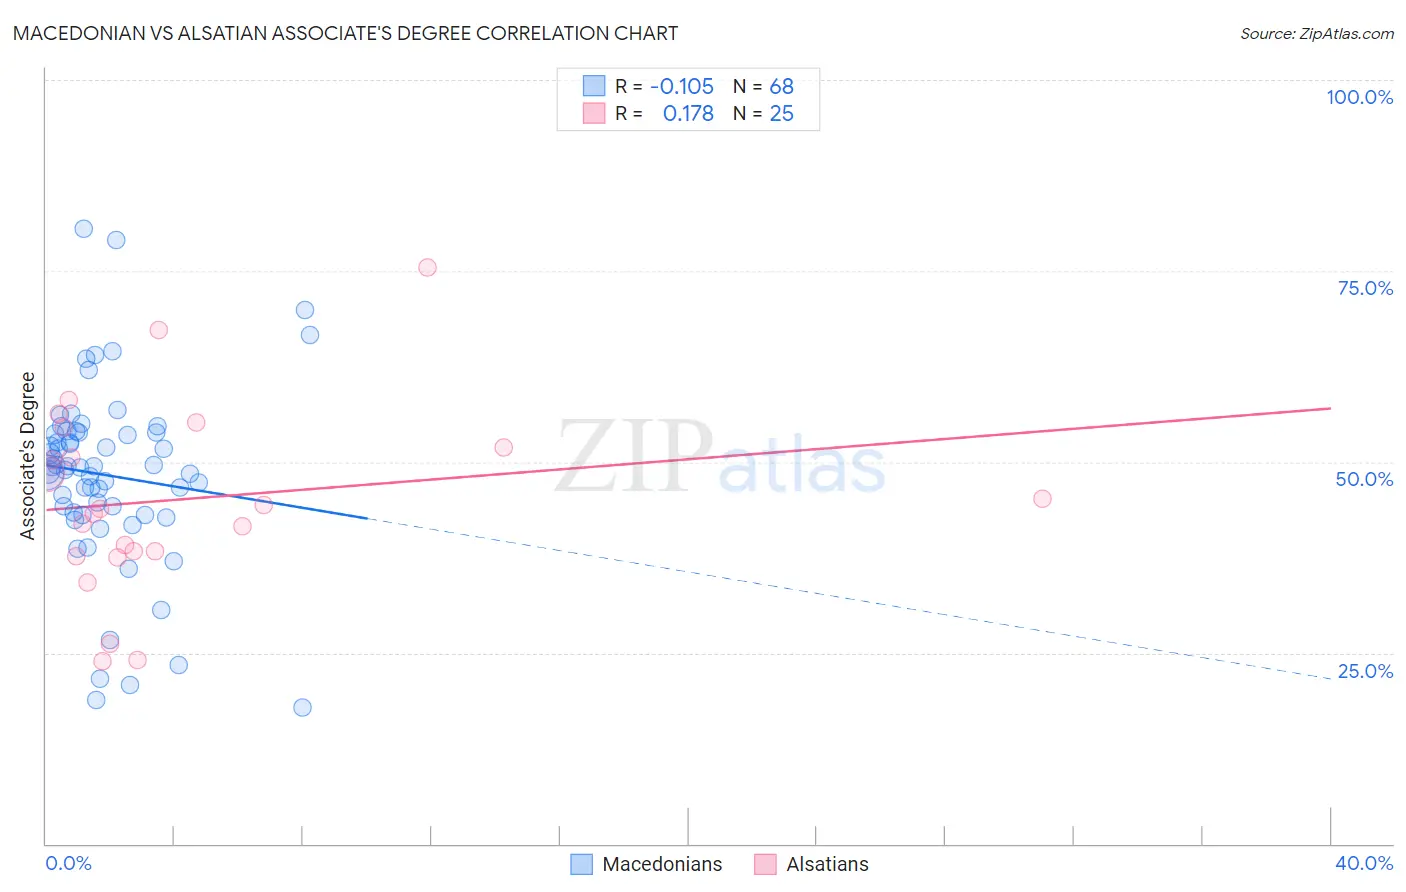
Macedonian vs Alsatian Associate's Degree Correlation Chart
The statistical analysis conducted on geographies consisting of 132,656,097 people shows a poor negative correlation between the proportion of Macedonians and percentage of population with at least associate's degree education in the United States with a correlation coefficient (R) of -0.105 and weighted average of 49.6%. Similarly, the statistical analysis conducted on geographies consisting of 82,682,365 people shows a poor positive correlation between the proportion of Alsatians and percentage of population with at least associate's degree education in the United States with a correlation coefficient (R) of 0.178 and weighted average of 48.8%, a difference of 1.7%.
Associate's Degree Correlation Summary
| Measurement | Macedonian | Alsatian |
| Minimum | 17.8% | 23.9% |
| Maximum | 80.6% | 75.4% |
| Range | 62.7% | 51.6% |
| Mean | 48.2% | 45.1% |
| Median | 49.4% | 43.9% |
| Interquartile 25% (IQ1) | 43.2% | 38.0% |
| Interquartile 75% (IQ3) | 53.9% | 53.2% |
| Interquartile Range (IQR) | 10.6% | 15.2% |
| Standard Deviation (Sample) | 12.1% | 12.3% |
| Standard Deviation (Population) | 12.0% | 12.1% |
Similar Demographics by Associate's Degree
Demographics Similar to Macedonians by Associate's Degree
In terms of associate's degree, the demographic groups most similar to Macedonians are Immigrants from Northern Africa (49.7%, a difference of 0.070%), Romanian (49.7%, a difference of 0.16%), Immigrants from Ukraine (49.7%, a difference of 0.16%), Immigrants from England (49.7%, a difference of 0.18%), and Immigrants from Nepal (49.5%, a difference of 0.22%).
| Demographics | Rating | Rank | Associate's Degree |
| Immigrants | North America | 98.7 /100 | #92 | Exceptional 50.1% |
| Immigrants | Brazil | 98.5 /100 | #93 | Exceptional 50.0% |
| Laotians | 98.4 /100 | #94 | Exceptional 49.9% |
| Immigrants | England | 98.0 /100 | #95 | Exceptional 49.7% |
| Romanians | 98.0 /100 | #96 | Exceptional 49.7% |
| Immigrants | Ukraine | 98.0 /100 | #97 | Exceptional 49.7% |
| Immigrants | Northern Africa | 97.9 /100 | #98 | Exceptional 49.7% |
| Macedonians | 97.8 /100 | #99 | Exceptional 49.6% |
| Immigrants | Nepal | 97.5 /100 | #100 | Exceptional 49.5% |
| Northern Europeans | 97.3 /100 | #101 | Exceptional 49.5% |
| Chileans | 97.3 /100 | #102 | Exceptional 49.4% |
| Ukrainians | 97.1 /100 | #103 | Exceptional 49.4% |
| Venezuelans | 97.0 /100 | #104 | Exceptional 49.4% |
| Croatians | 96.8 /100 | #105 | Exceptional 49.3% |
| Immigrants | Italy | 96.7 /100 | #106 | Exceptional 49.3% |
Demographics Similar to Alsatians by Associate's Degree
In terms of associate's degree, the demographic groups most similar to Alsatians are Lebanese (48.8%, a difference of 0.020%), Albanian (48.8%, a difference of 0.030%), Afghan (48.9%, a difference of 0.10%), British (48.9%, a difference of 0.14%), and Luxembourger (48.9%, a difference of 0.20%).
| Demographics | Rating | Rank | Associate's Degree |
| Palestinians | 95.3 /100 | #113 | Exceptional 49.0% |
| Arabs | 95.3 /100 | #114 | Exceptional 49.0% |
| Luxembourgers | 95.1 /100 | #115 | Exceptional 48.9% |
| British | 95.0 /100 | #116 | Exceptional 48.9% |
| Afghans | 94.8 /100 | #117 | Exceptional 48.9% |
| Albanians | 94.7 /100 | #118 | Exceptional 48.8% |
| Lebanese | 94.6 /100 | #119 | Exceptional 48.8% |
| Alsatians | 94.6 /100 | #120 | Exceptional 48.8% |
| Ugandans | 93.9 /100 | #121 | Exceptional 48.7% |
| Italians | 93.9 /100 | #122 | Exceptional 48.7% |
| Brazilians | 93.7 /100 | #123 | Exceptional 48.7% |
| Serbians | 92.6 /100 | #124 | Exceptional 48.5% |
| Chinese | 92.5 /100 | #125 | Exceptional 48.5% |
| Immigrants | Syria | 92.2 /100 | #126 | Exceptional 48.5% |
| Immigrants | Uganda | 92.1 /100 | #127 | Exceptional 48.5% |