Luxembourger vs Immigrants from Uruguay Doctorate Degree
COMPARE
Luxembourger
Immigrants from Uruguay
Doctorate Degree
Doctorate Degree Comparison
Luxembourgers
Immigrants from Uruguay
1.9%
DOCTORATE DEGREE
81.1/ 100
METRIC RATING
148th/ 347
METRIC RANK
1.7%
DOCTORATE DEGREE
9.2/ 100
METRIC RATING
220th/ 347
METRIC RANK
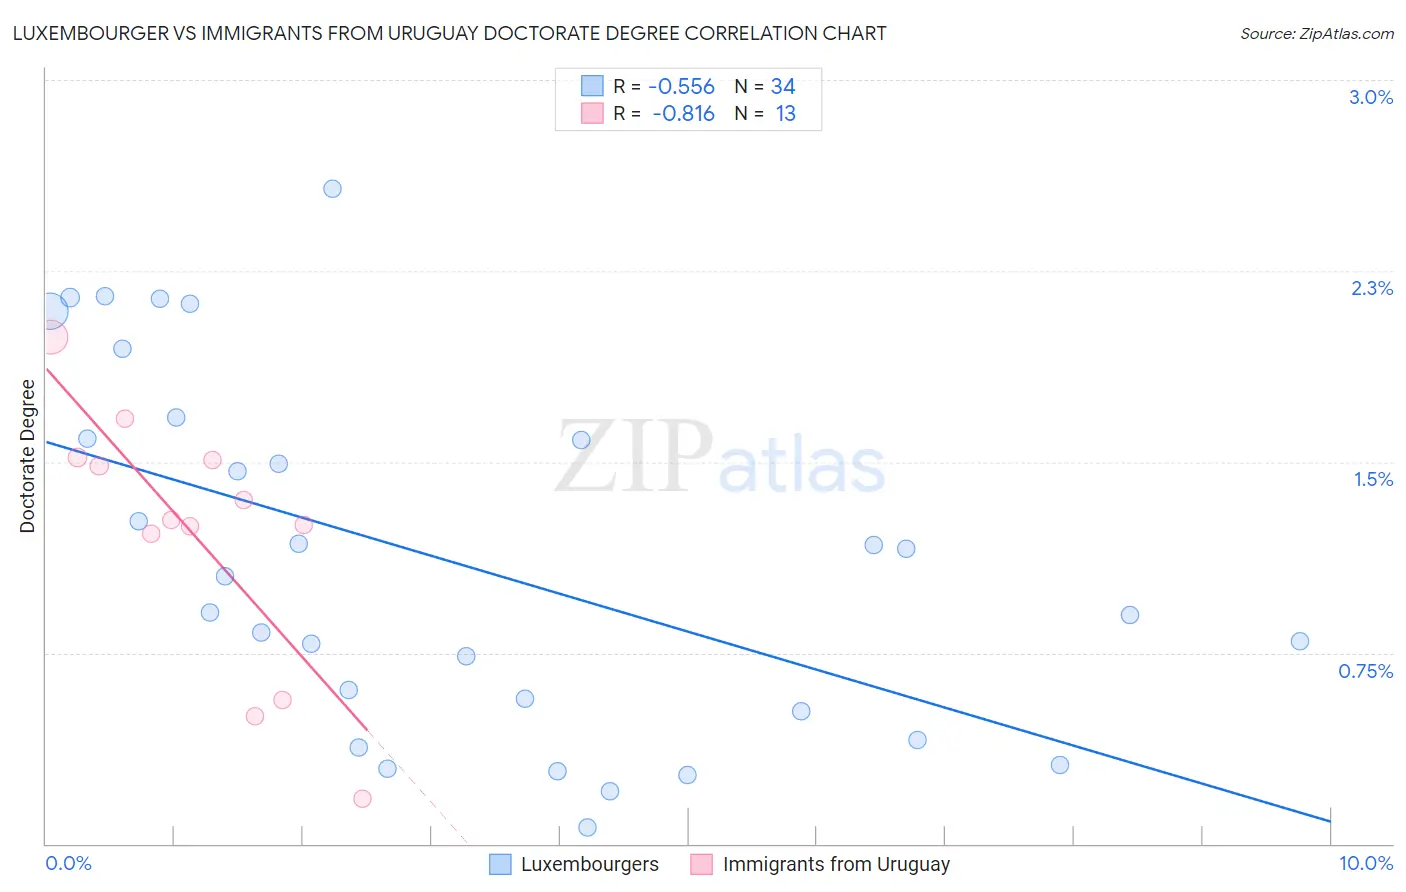
Luxembourger vs Immigrants from Uruguay Doctorate Degree Correlation Chart
The statistical analysis conducted on geographies consisting of 144,093,078 people shows a substantial negative correlation between the proportion of Luxembourgers and percentage of population with at least doctorate degree education in the United States with a correlation coefficient (R) of -0.556 and weighted average of 1.9%. Similarly, the statistical analysis conducted on geographies consisting of 133,064,072 people shows a very strong negative correlation between the proportion of Immigrants from Uruguay and percentage of population with at least doctorate degree education in the United States with a correlation coefficient (R) of -0.816 and weighted average of 1.7%, a difference of 15.0%.
Doctorate Degree Correlation Summary
| Measurement | Luxembourger | Immigrants from Uruguay |
| Minimum | 0.063% | 0.18% |
| Maximum | 2.6% | 2.0% |
| Range | 2.5% | 1.8% |
| Mean | 1.1% | 1.2% |
| Median | 0.98% | 1.3% |
| Interquartile 25% (IQ1) | 0.52% | 0.89% |
| Interquartile 75% (IQ3) | 1.6% | 1.5% |
| Interquartile Range (IQR) | 1.1% | 0.62% |
| Standard Deviation (Sample) | 0.70% | 0.51% |
| Standard Deviation (Population) | 0.69% | 0.49% |
Similar Demographics by Doctorate Degree
Demographics Similar to Luxembourgers by Doctorate Degree
In terms of doctorate degree, the demographic groups most similar to Luxembourgers are Immigrants from Senegal (1.9%, a difference of 0.33%), Immigrants from Syria (1.9%, a difference of 0.58%), Kenyan (1.9%, a difference of 0.60%), Immigrants from Moldova (2.0%, a difference of 0.78%), and Basque (1.9%, a difference of 0.90%).
| Demographics | Rating | Rank | Doctorate Degree |
| Senegalese | 86.7 /100 | #141 | Excellent 2.0% |
| Italians | 86.0 /100 | #142 | Excellent 2.0% |
| Sierra Leoneans | 85.1 /100 | #143 | Excellent 2.0% |
| Immigrants | Moldova | 84.3 /100 | #144 | Excellent 2.0% |
| Kenyans | 83.6 /100 | #145 | Excellent 1.9% |
| Immigrants | Syria | 83.6 /100 | #146 | Excellent 1.9% |
| Immigrants | Senegal | 82.5 /100 | #147 | Excellent 1.9% |
| Luxembourgers | 81.1 /100 | #148 | Excellent 1.9% |
| Basques | 76.9 /100 | #149 | Good 1.9% |
| English | 75.9 /100 | #150 | Good 1.9% |
| Albanians | 74.8 /100 | #151 | Good 1.9% |
| Immigrants | Kenya | 74.3 /100 | #152 | Good 1.9% |
| Immigrants | Oceania | 74.0 /100 | #153 | Good 1.9% |
| Immigrants | Albania | 72.8 /100 | #154 | Good 1.9% |
| Poles | 72.7 /100 | #155 | Good 1.9% |
Demographics Similar to Immigrants from Uruguay by Doctorate Degree
In terms of doctorate degree, the demographic groups most similar to Immigrants from Uruguay are Nonimmigrants (1.7%, a difference of 0.19%), Immigrants from Venezuela (1.7%, a difference of 0.26%), Immigrants from Iraq (1.7%, a difference of 0.66%), Immigrants from Bosnia and Herzegovina (1.7%, a difference of 0.72%), and Immigrants from Poland (1.7%, a difference of 0.94%).
| Demographics | Rating | Rank | Doctorate Degree |
| Koreans | 14.2 /100 | #213 | Poor 1.7% |
| Pueblo | 14.2 /100 | #214 | Poor 1.7% |
| Alaskan Athabascans | 13.8 /100 | #215 | Poor 1.7% |
| Immigrants | Burma/Myanmar | 13.5 /100 | #216 | Poor 1.7% |
| Spanish Americans | 12.9 /100 | #217 | Poor 1.7% |
| Tlingit-Haida | 11.9 /100 | #218 | Poor 1.7% |
| Immigrants | Iraq | 10.7 /100 | #219 | Poor 1.7% |
| Immigrants | Uruguay | 9.2 /100 | #220 | Tragic 1.7% |
| Immigrants | Nonimmigrants | 8.8 /100 | #221 | Tragic 1.7% |
| Immigrants | Venezuela | 8.7 /100 | #222 | Tragic 1.7% |
| Immigrants | Bosnia and Herzegovina | 7.8 /100 | #223 | Tragic 1.7% |
| Immigrants | Poland | 7.4 /100 | #224 | Tragic 1.7% |
| Immigrants | Colombia | 6.7 /100 | #225 | Tragic 1.7% |
| Osage | 6.5 /100 | #226 | Tragic 1.7% |
| Panamanians | 6.3 /100 | #227 | Tragic 1.7% |