Luxembourger vs Tsimshian Doctorate Degree
COMPARE
Luxembourger
Tsimshian
Doctorate Degree
Doctorate Degree Comparison
Luxembourgers
Tsimshian
1.9%
DOCTORATE DEGREE
81.1/ 100
METRIC RATING
148th/ 347
METRIC RANK
1.4%
DOCTORATE DEGREE
0.2/ 100
METRIC RATING
297th/ 347
METRIC RANK
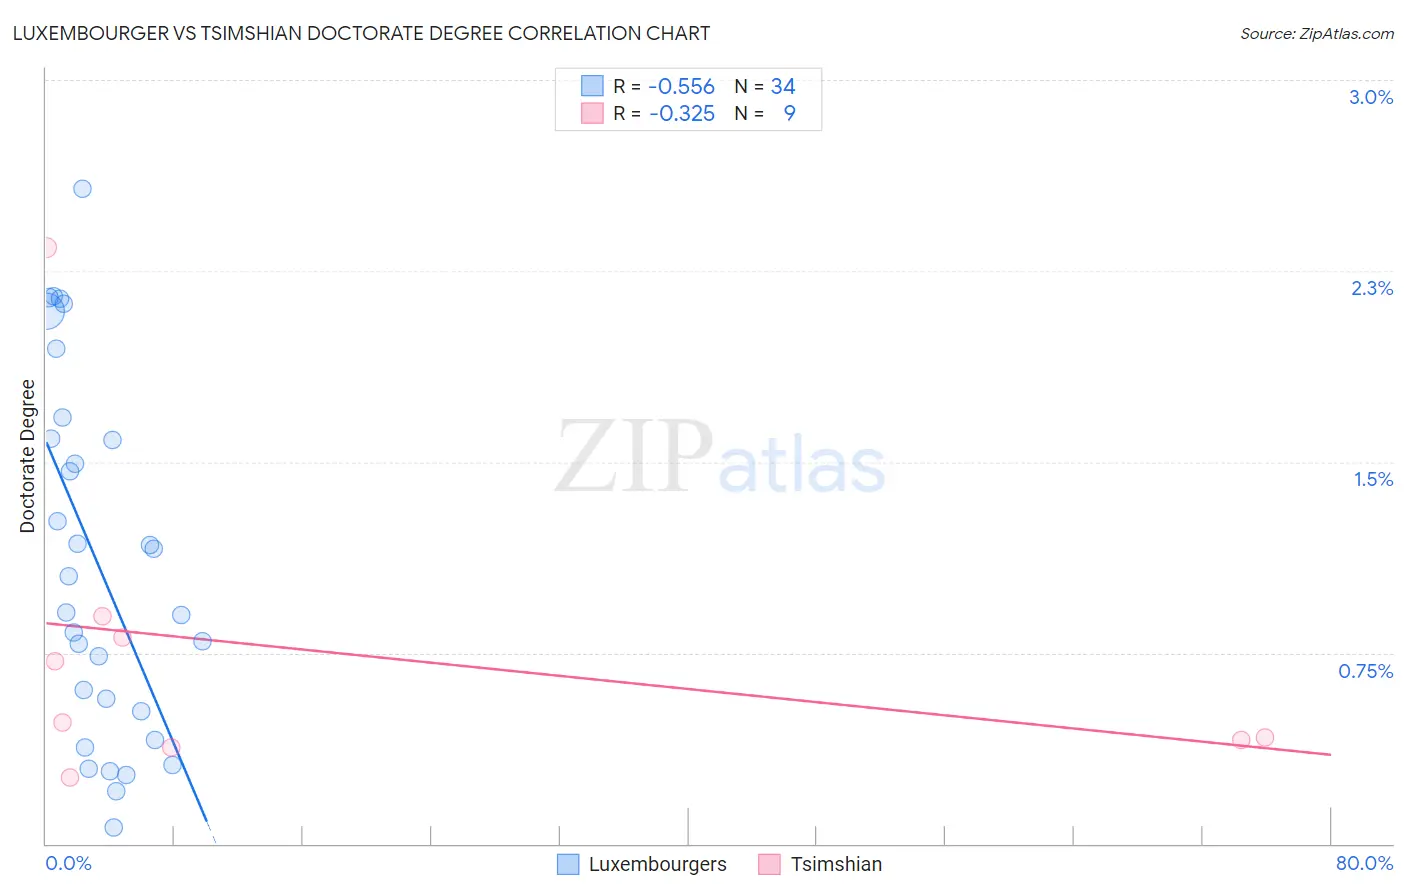
Luxembourger vs Tsimshian Doctorate Degree Correlation Chart
The statistical analysis conducted on geographies consisting of 144,093,078 people shows a substantial negative correlation between the proportion of Luxembourgers and percentage of population with at least doctorate degree education in the United States with a correlation coefficient (R) of -0.556 and weighted average of 1.9%. Similarly, the statistical analysis conducted on geographies consisting of 15,584,822 people shows a mild negative correlation between the proportion of Tsimshian and percentage of population with at least doctorate degree education in the United States with a correlation coefficient (R) of -0.325 and weighted average of 1.4%, a difference of 37.8%.
Doctorate Degree Correlation Summary
| Measurement | Luxembourger | Tsimshian |
| Minimum | 0.063% | 0.26% |
| Maximum | 2.6% | 2.3% |
| Range | 2.5% | 2.1% |
| Mean | 1.1% | 0.74% |
| Median | 0.98% | 0.48% |
| Interquartile 25% (IQ1) | 0.52% | 0.39% |
| Interquartile 75% (IQ3) | 1.6% | 0.85% |
| Interquartile Range (IQR) | 1.1% | 0.46% |
| Standard Deviation (Sample) | 0.70% | 0.64% |
| Standard Deviation (Population) | 0.69% | 0.60% |
Similar Demographics by Doctorate Degree
Demographics Similar to Luxembourgers by Doctorate Degree
In terms of doctorate degree, the demographic groups most similar to Luxembourgers are Immigrants from Senegal (1.9%, a difference of 0.33%), Immigrants from Syria (1.9%, a difference of 0.58%), Kenyan (1.9%, a difference of 0.60%), Immigrants from Moldova (2.0%, a difference of 0.78%), and Basque (1.9%, a difference of 0.90%).
| Demographics | Rating | Rank | Doctorate Degree |
| Senegalese | 86.7 /100 | #141 | Excellent 2.0% |
| Italians | 86.0 /100 | #142 | Excellent 2.0% |
| Sierra Leoneans | 85.1 /100 | #143 | Excellent 2.0% |
| Immigrants | Moldova | 84.3 /100 | #144 | Excellent 2.0% |
| Kenyans | 83.6 /100 | #145 | Excellent 1.9% |
| Immigrants | Syria | 83.6 /100 | #146 | Excellent 1.9% |
| Immigrants | Senegal | 82.5 /100 | #147 | Excellent 1.9% |
| Luxembourgers | 81.1 /100 | #148 | Excellent 1.9% |
| Basques | 76.9 /100 | #149 | Good 1.9% |
| English | 75.9 /100 | #150 | Good 1.9% |
| Albanians | 74.8 /100 | #151 | Good 1.9% |
| Immigrants | Kenya | 74.3 /100 | #152 | Good 1.9% |
| Immigrants | Oceania | 74.0 /100 | #153 | Good 1.9% |
| Immigrants | Albania | 72.8 /100 | #154 | Good 1.9% |
| Poles | 72.7 /100 | #155 | Good 1.9% |
Demographics Similar to Tsimshian by Doctorate Degree
In terms of doctorate degree, the demographic groups most similar to Tsimshian are Immigrants from Ecuador (1.4%, a difference of 0.22%), Puerto Rican (1.4%, a difference of 0.41%), Guatemalan (1.4%, a difference of 0.45%), Belizean (1.4%, a difference of 0.85%), and Samoan (1.4%, a difference of 1.1%).
| Demographics | Rating | Rank | Doctorate Degree |
| Choctaw | 0.3 /100 | #290 | Tragic 1.4% |
| Blacks/African Americans | 0.3 /100 | #291 | Tragic 1.4% |
| Alaska Natives | 0.3 /100 | #292 | Tragic 1.4% |
| Immigrants | Yemen | 0.2 /100 | #293 | Tragic 1.4% |
| Samoans | 0.2 /100 | #294 | Tragic 1.4% |
| Guatemalans | 0.2 /100 | #295 | Tragic 1.4% |
| Immigrants | Ecuador | 0.2 /100 | #296 | Tragic 1.4% |
| Tsimshian | 0.2 /100 | #297 | Tragic 1.4% |
| Puerto Ricans | 0.1 /100 | #298 | Tragic 1.4% |
| Belizeans | 0.1 /100 | #299 | Tragic 1.4% |
| Immigrants | Guatemala | 0.1 /100 | #300 | Tragic 1.4% |
| Hondurans | 0.1 /100 | #301 | Tragic 1.4% |
| Shoshone | 0.1 /100 | #302 | Tragic 1.4% |
| Immigrants | Dominica | 0.1 /100 | #303 | Tragic 1.4% |
| Mexican American Indians | 0.1 /100 | #304 | Tragic 1.4% |