Danish vs Latvian Doctorate Degree
COMPARE
Danish
Latvian
Doctorate Degree
Doctorate Degree Comparison
Danes
Latvians
1.9%
DOCTORATE DEGREE
71.9/ 100
METRIC RATING
157th/ 347
METRIC RANK
2.6%
DOCTORATE DEGREE
100.0/ 100
METRIC RATING
31st/ 347
METRIC RANK
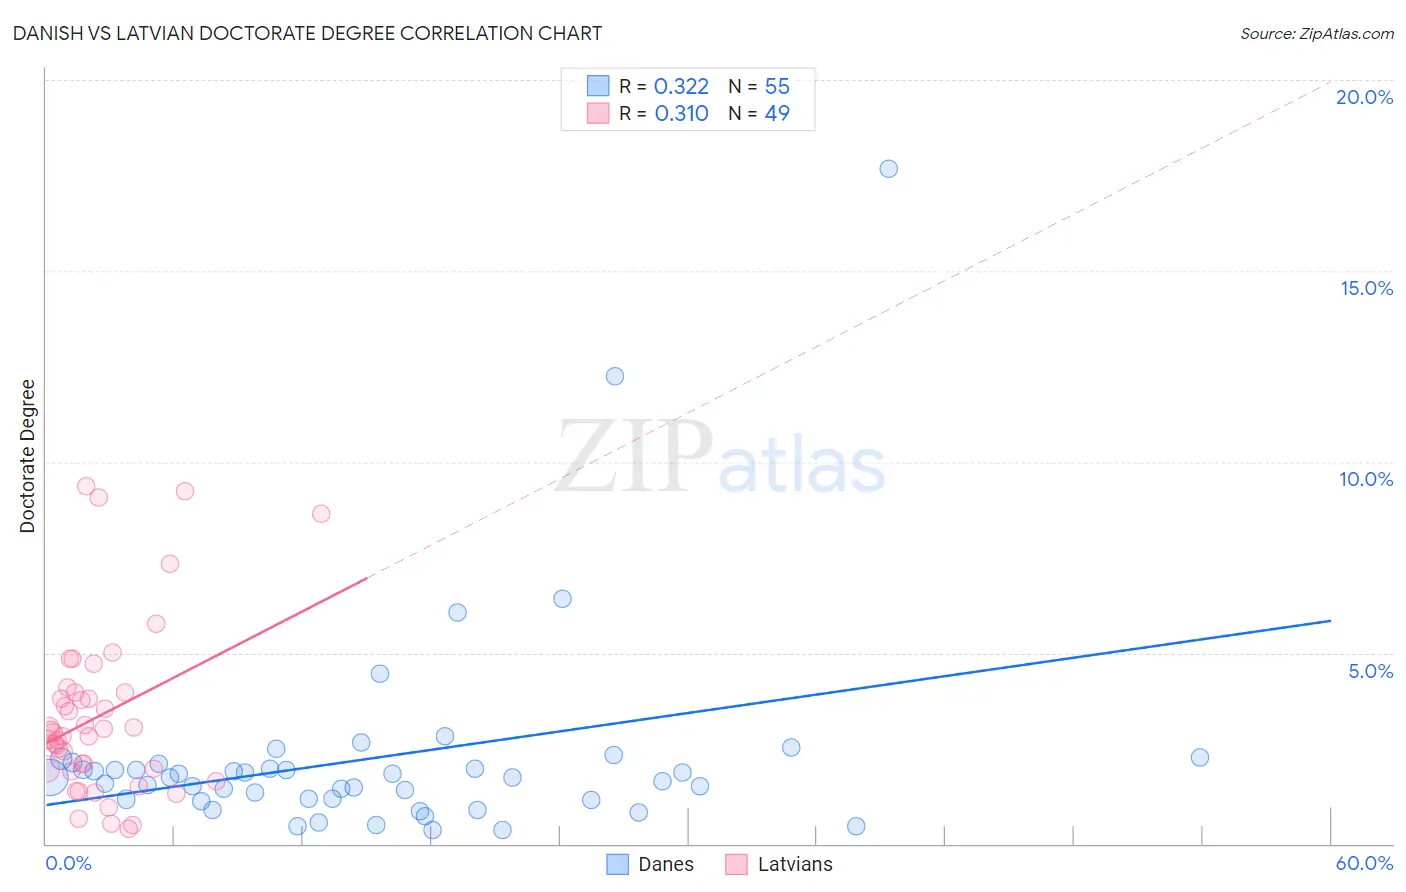
Danish vs Latvian Doctorate Degree Correlation Chart
The statistical analysis conducted on geographies consisting of 464,600,564 people shows a mild positive correlation between the proportion of Danes and percentage of population with at least doctorate degree education in the United States with a correlation coefficient (R) of 0.322 and weighted average of 1.9%. Similarly, the statistical analysis conducted on geographies consisting of 219,954,299 people shows a mild positive correlation between the proportion of Latvians and percentage of population with at least doctorate degree education in the United States with a correlation coefficient (R) of 0.310 and weighted average of 2.6%, a difference of 35.5%.
Doctorate Degree Correlation Summary
| Measurement | Danish | Latvian |
| Minimum | 0.36% | 0.38% |
| Maximum | 17.7% | 9.4% |
| Range | 17.3% | 9.0% |
| Mean | 2.3% | 3.3% |
| Median | 1.7% | 2.9% |
| Interquartile 25% (IQ1) | 1.2% | 1.9% |
| Interquartile 75% (IQ3) | 2.1% | 4.0% |
| Interquartile Range (IQR) | 0.94% | 2.0% |
| Standard Deviation (Sample) | 2.8% | 2.2% |
| Standard Deviation (Population) | 2.8% | 2.2% |
Similar Demographics by Doctorate Degree
Demographics Similar to Danes by Doctorate Degree
In terms of doctorate degree, the demographic groups most similar to Danes are Hungarian (1.9%, a difference of 0.030%), Slavic (1.9%, a difference of 0.090%), Polish (1.9%, a difference of 0.14%), Immigrants from Albania (1.9%, a difference of 0.16%), and Slovene (1.9%, a difference of 0.29%).
| Demographics | Rating | Rank | Doctorate Degree |
| English | 75.9 /100 | #150 | Good 1.9% |
| Albanians | 74.8 /100 | #151 | Good 1.9% |
| Immigrants | Kenya | 74.3 /100 | #152 | Good 1.9% |
| Immigrants | Oceania | 74.0 /100 | #153 | Good 1.9% |
| Immigrants | Albania | 72.8 /100 | #154 | Good 1.9% |
| Poles | 72.7 /100 | #155 | Good 1.9% |
| Slavs | 72.4 /100 | #156 | Good 1.9% |
| Danes | 71.9 /100 | #157 | Good 1.9% |
| Hungarians | 71.7 /100 | #158 | Good 1.9% |
| Slovenes | 70.2 /100 | #159 | Good 1.9% |
| Welsh | 69.7 /100 | #160 | Good 1.9% |
| Immigrants | Middle Africa | 68.8 /100 | #161 | Good 1.9% |
| Irish | 67.5 /100 | #162 | Good 1.9% |
| Czechs | 67.3 /100 | #163 | Good 1.9% |
| Celtics | 66.7 /100 | #164 | Good 1.9% |
Demographics Similar to Latvians by Doctorate Degree
In terms of doctorate degree, the demographic groups most similar to Latvians are Immigrants from Northern Europe (2.6%, a difference of 0.15%), Cambodian (2.6%, a difference of 0.33%), Cypriot (2.6%, a difference of 0.44%), Immigrants from Malaysia (2.6%, a difference of 0.50%), and Immigrants from Spain (2.6%, a difference of 0.56%).
| Demographics | Rating | Rank | Doctorate Degree |
| Israelis | 100.0 /100 | #24 | Exceptional 2.7% |
| Immigrants | Saudi Arabia | 100.0 /100 | #25 | Exceptional 2.7% |
| Turks | 100.0 /100 | #26 | Exceptional 2.7% |
| Immigrants | Turkey | 100.0 /100 | #27 | Exceptional 2.6% |
| Burmese | 100.0 /100 | #28 | Exceptional 2.6% |
| Immigrants | South Central Asia | 100.0 /100 | #29 | Exceptional 2.6% |
| Immigrants | Korea | 100.0 /100 | #30 | Exceptional 2.6% |
| Latvians | 100.0 /100 | #31 | Exceptional 2.6% |
| Immigrants | Northern Europe | 100.0 /100 | #32 | Exceptional 2.6% |
| Cambodians | 100.0 /100 | #33 | Exceptional 2.6% |
| Cypriots | 100.0 /100 | #34 | Exceptional 2.6% |
| Immigrants | Malaysia | 100.0 /100 | #35 | Exceptional 2.6% |
| Immigrants | Spain | 100.0 /100 | #36 | Exceptional 2.6% |
| Immigrants | Kuwait | 100.0 /100 | #37 | Exceptional 2.6% |
| Russians | 100.0 /100 | #38 | Exceptional 2.6% |