Indonesian vs Latvian Doctorate Degree
COMPARE
Indonesian
Latvian
Doctorate Degree
Doctorate Degree Comparison
Indonesians
Latvians
1.6%
DOCTORATE DEGREE
2.8/ 100
METRIC RATING
236th/ 347
METRIC RANK
2.6%
DOCTORATE DEGREE
100.0/ 100
METRIC RATING
31st/ 347
METRIC RANK
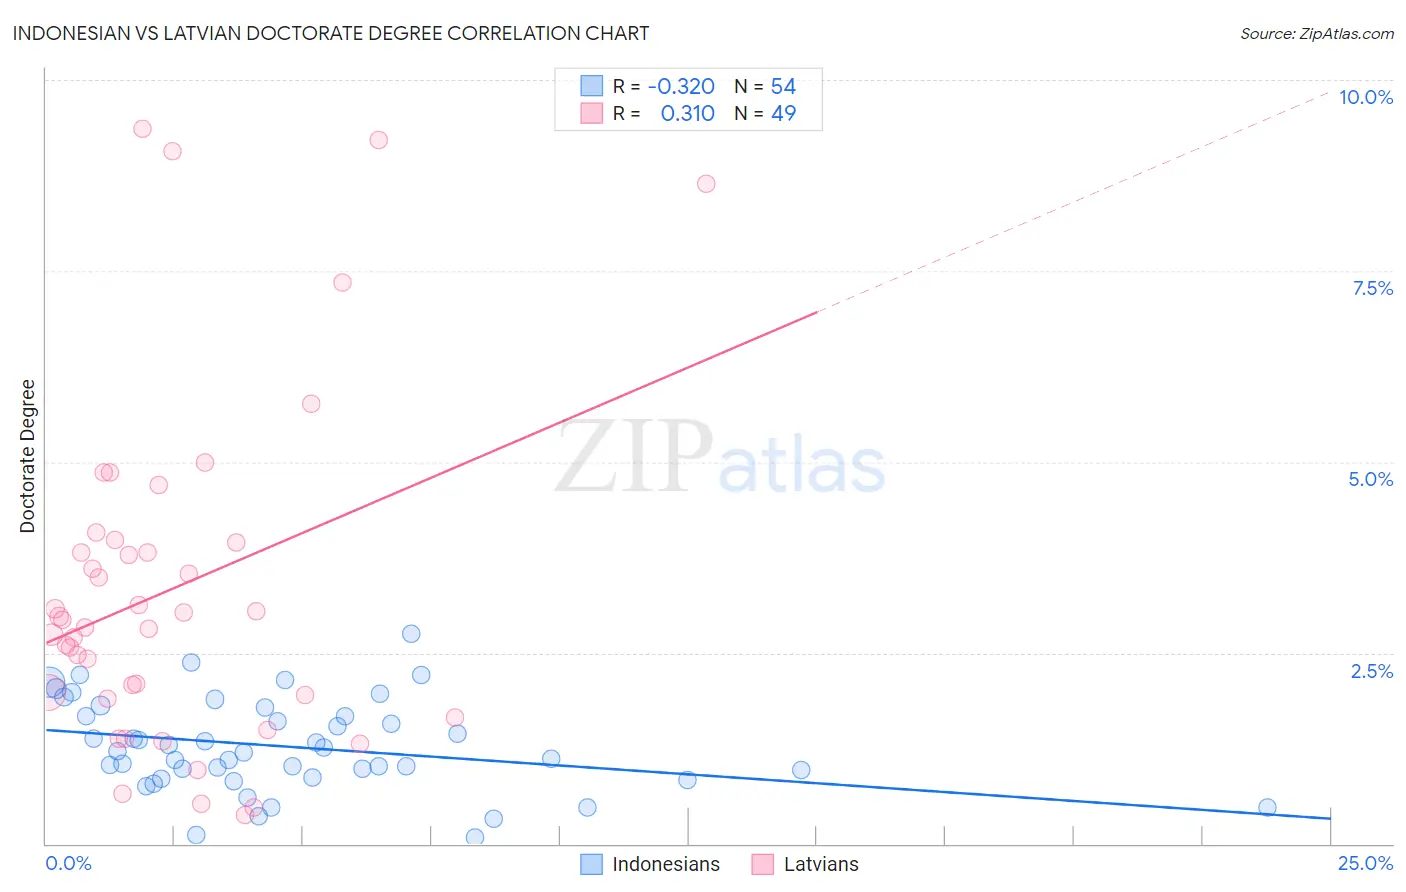
Indonesian vs Latvian Doctorate Degree Correlation Chart
The statistical analysis conducted on geographies consisting of 162,227,737 people shows a mild negative correlation between the proportion of Indonesians and percentage of population with at least doctorate degree education in the United States with a correlation coefficient (R) of -0.320 and weighted average of 1.6%. Similarly, the statistical analysis conducted on geographies consisting of 219,954,299 people shows a mild positive correlation between the proportion of Latvians and percentage of population with at least doctorate degree education in the United States with a correlation coefficient (R) of 0.310 and weighted average of 2.6%, a difference of 61.0%.
Doctorate Degree Correlation Summary
| Measurement | Indonesian | Latvian |
| Minimum | 0.089% | 0.38% |
| Maximum | 2.7% | 9.4% |
| Range | 2.7% | 9.0% |
| Mean | 1.3% | 3.3% |
| Median | 1.2% | 2.9% |
| Interquartile 25% (IQ1) | 0.86% | 1.9% |
| Interquartile 75% (IQ3) | 1.7% | 4.0% |
| Interquartile Range (IQR) | 0.81% | 2.0% |
| Standard Deviation (Sample) | 0.60% | 2.2% |
| Standard Deviation (Population) | 0.59% | 2.2% |
Similar Demographics by Doctorate Degree
Demographics Similar to Indonesians by Doctorate Degree
In terms of doctorate degree, the demographic groups most similar to Indonesians are Iroquois (1.6%, a difference of 0.19%), Cree (1.6%, a difference of 0.29%), Immigrants from Congo (1.6%, a difference of 0.39%), Hopi (1.6%, a difference of 0.50%), and West Indian (1.6%, a difference of 0.50%).
| Demographics | Rating | Rank | Doctorate Degree |
| Colville | 4.7 /100 | #229 | Tragic 1.6% |
| Immigrants | Philippines | 4.3 /100 | #230 | Tragic 1.6% |
| Immigrants | North Macedonia | 3.9 /100 | #231 | Tragic 1.6% |
| Guamanians/Chamorros | 3.3 /100 | #232 | Tragic 1.6% |
| Barbadians | 3.3 /100 | #233 | Tragic 1.6% |
| Hopi | 3.2 /100 | #234 | Tragic 1.6% |
| Cree | 3.0 /100 | #235 | Tragic 1.6% |
| Indonesians | 2.8 /100 | #236 | Tragic 1.6% |
| Iroquois | 2.7 /100 | #237 | Tragic 1.6% |
| Immigrants | Congo | 2.6 /100 | #238 | Tragic 1.6% |
| West Indians | 2.5 /100 | #239 | Tragic 1.6% |
| Immigrants | Panama | 2.4 /100 | #240 | Tragic 1.6% |
| Cheyenne | 2.3 /100 | #241 | Tragic 1.6% |
| Ottawa | 2.2 /100 | #242 | Tragic 1.6% |
| Native Hawaiians | 2.1 /100 | #243 | Tragic 1.6% |
Demographics Similar to Latvians by Doctorate Degree
In terms of doctorate degree, the demographic groups most similar to Latvians are Immigrants from Northern Europe (2.6%, a difference of 0.15%), Cambodian (2.6%, a difference of 0.33%), Cypriot (2.6%, a difference of 0.44%), Immigrants from Malaysia (2.6%, a difference of 0.50%), and Immigrants from Spain (2.6%, a difference of 0.56%).
| Demographics | Rating | Rank | Doctorate Degree |
| Israelis | 100.0 /100 | #24 | Exceptional 2.7% |
| Immigrants | Saudi Arabia | 100.0 /100 | #25 | Exceptional 2.7% |
| Turks | 100.0 /100 | #26 | Exceptional 2.7% |
| Immigrants | Turkey | 100.0 /100 | #27 | Exceptional 2.6% |
| Burmese | 100.0 /100 | #28 | Exceptional 2.6% |
| Immigrants | South Central Asia | 100.0 /100 | #29 | Exceptional 2.6% |
| Immigrants | Korea | 100.0 /100 | #30 | Exceptional 2.6% |
| Latvians | 100.0 /100 | #31 | Exceptional 2.6% |
| Immigrants | Northern Europe | 100.0 /100 | #32 | Exceptional 2.6% |
| Cambodians | 100.0 /100 | #33 | Exceptional 2.6% |
| Cypriots | 100.0 /100 | #34 | Exceptional 2.6% |
| Immigrants | Malaysia | 100.0 /100 | #35 | Exceptional 2.6% |
| Immigrants | Spain | 100.0 /100 | #36 | Exceptional 2.6% |
| Immigrants | Kuwait | 100.0 /100 | #37 | Exceptional 2.6% |
| Russians | 100.0 /100 | #38 | Exceptional 2.6% |