Syrian vs Latvian Doctorate Degree
COMPARE
Syrian
Latvian
Doctorate Degree
Doctorate Degree Comparison
Syrians
Latvians
2.1%
DOCTORATE DEGREE
97.1/ 100
METRIC RATING
112th/ 347
METRIC RANK
2.6%
DOCTORATE DEGREE
100.0/ 100
METRIC RATING
31st/ 347
METRIC RANK
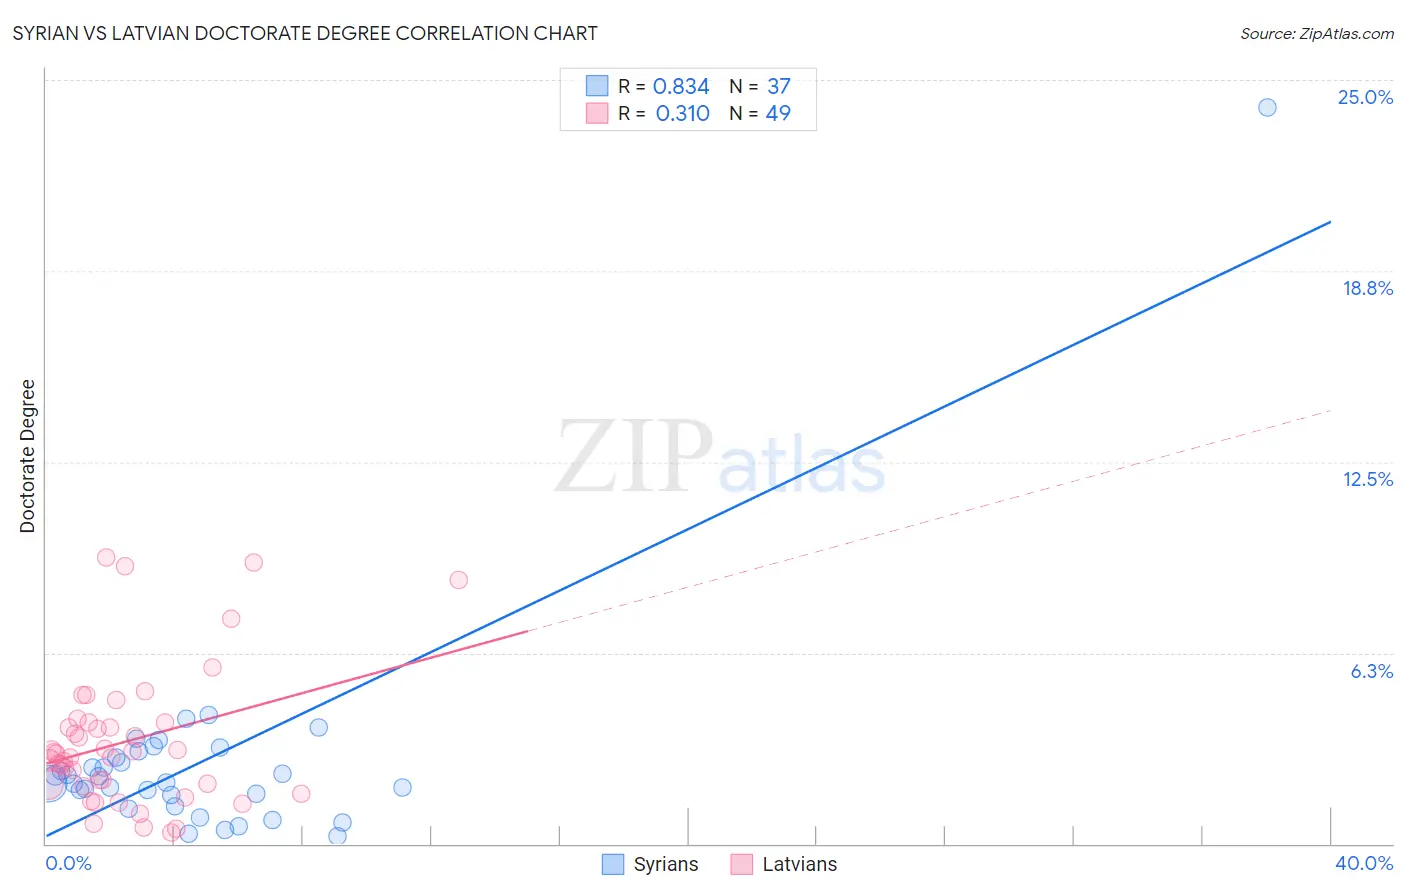
Syrian vs Latvian Doctorate Degree Correlation Chart
The statistical analysis conducted on geographies consisting of 265,258,861 people shows a very strong positive correlation between the proportion of Syrians and percentage of population with at least doctorate degree education in the United States with a correlation coefficient (R) of 0.834 and weighted average of 2.1%. Similarly, the statistical analysis conducted on geographies consisting of 219,954,299 people shows a mild positive correlation between the proportion of Latvians and percentage of population with at least doctorate degree education in the United States with a correlation coefficient (R) of 0.310 and weighted average of 2.6%, a difference of 24.1%.
Doctorate Degree Correlation Summary
| Measurement | Syrian | Latvian |
| Minimum | 0.24% | 0.38% |
| Maximum | 24.1% | 9.4% |
| Range | 23.9% | 9.0% |
| Mean | 2.7% | 3.3% |
| Median | 2.0% | 2.9% |
| Interquartile 25% (IQ1) | 1.4% | 1.9% |
| Interquartile 75% (IQ3) | 2.9% | 4.0% |
| Interquartile Range (IQR) | 1.5% | 2.0% |
| Standard Deviation (Sample) | 3.8% | 2.2% |
| Standard Deviation (Population) | 3.7% | 2.2% |
Similar Demographics by Doctorate Degree
Demographics Similar to Syrians by Doctorate Degree
In terms of doctorate degree, the demographic groups most similar to Syrians are Immigrants from Pakistan (2.1%, a difference of 0.020%), Brazilian (2.1%, a difference of 0.080%), Ukrainian (2.1%, a difference of 0.15%), Immigrants from Germany (2.1%, a difference of 0.21%), and Immigrants from Italy (2.1%, a difference of 0.21%).
| Demographics | Rating | Rank | Doctorate Degree |
| Arabs | 97.8 /100 | #105 | Exceptional 2.1% |
| Sudanese | 97.7 /100 | #106 | Exceptional 2.1% |
| Europeans | 97.5 /100 | #107 | Exceptional 2.1% |
| Immigrants | Germany | 97.3 /100 | #108 | Exceptional 2.1% |
| Ukrainians | 97.2 /100 | #109 | Exceptional 2.1% |
| Brazilians | 97.2 /100 | #110 | Exceptional 2.1% |
| Immigrants | Pakistan | 97.1 /100 | #111 | Exceptional 2.1% |
| Syrians | 97.1 /100 | #112 | Exceptional 2.1% |
| Immigrants | Italy | 96.9 /100 | #113 | Exceptional 2.1% |
| Immigrants | Croatia | 96.8 /100 | #114 | Exceptional 2.1% |
| Taiwanese | 96.7 /100 | #115 | Exceptional 2.1% |
| Maltese | 96.2 /100 | #116 | Exceptional 2.1% |
| Lebanese | 96.0 /100 | #117 | Exceptional 2.1% |
| Icelanders | 96.0 /100 | #118 | Exceptional 2.1% |
| Pakistanis | 95.8 /100 | #119 | Exceptional 2.0% |
Demographics Similar to Latvians by Doctorate Degree
In terms of doctorate degree, the demographic groups most similar to Latvians are Immigrants from Northern Europe (2.6%, a difference of 0.15%), Cambodian (2.6%, a difference of 0.33%), Cypriot (2.6%, a difference of 0.44%), Immigrants from Malaysia (2.6%, a difference of 0.50%), and Immigrants from Spain (2.6%, a difference of 0.56%).
| Demographics | Rating | Rank | Doctorate Degree |
| Israelis | 100.0 /100 | #24 | Exceptional 2.7% |
| Immigrants | Saudi Arabia | 100.0 /100 | #25 | Exceptional 2.7% |
| Turks | 100.0 /100 | #26 | Exceptional 2.7% |
| Immigrants | Turkey | 100.0 /100 | #27 | Exceptional 2.6% |
| Burmese | 100.0 /100 | #28 | Exceptional 2.6% |
| Immigrants | South Central Asia | 100.0 /100 | #29 | Exceptional 2.6% |
| Immigrants | Korea | 100.0 /100 | #30 | Exceptional 2.6% |
| Latvians | 100.0 /100 | #31 | Exceptional 2.6% |
| Immigrants | Northern Europe | 100.0 /100 | #32 | Exceptional 2.6% |
| Cambodians | 100.0 /100 | #33 | Exceptional 2.6% |
| Cypriots | 100.0 /100 | #34 | Exceptional 2.6% |
| Immigrants | Malaysia | 100.0 /100 | #35 | Exceptional 2.6% |
| Immigrants | Spain | 100.0 /100 | #36 | Exceptional 2.6% |
| Immigrants | Kuwait | 100.0 /100 | #37 | Exceptional 2.6% |
| Russians | 100.0 /100 | #38 | Exceptional 2.6% |