Luxembourger vs Immigrants from Poland Associate's Degree
COMPARE
Luxembourger
Immigrants from Poland
Associate's Degree
Associate's Degree Comparison
Luxembourgers
Immigrants from Poland
48.9%
ASSOCIATE'S DEGREE
95.1/ 100
METRIC RATING
115th/ 347
METRIC RANK
47.1%
ASSOCIATE'S DEGREE
69.2/ 100
METRIC RATING
159th/ 347
METRIC RANK
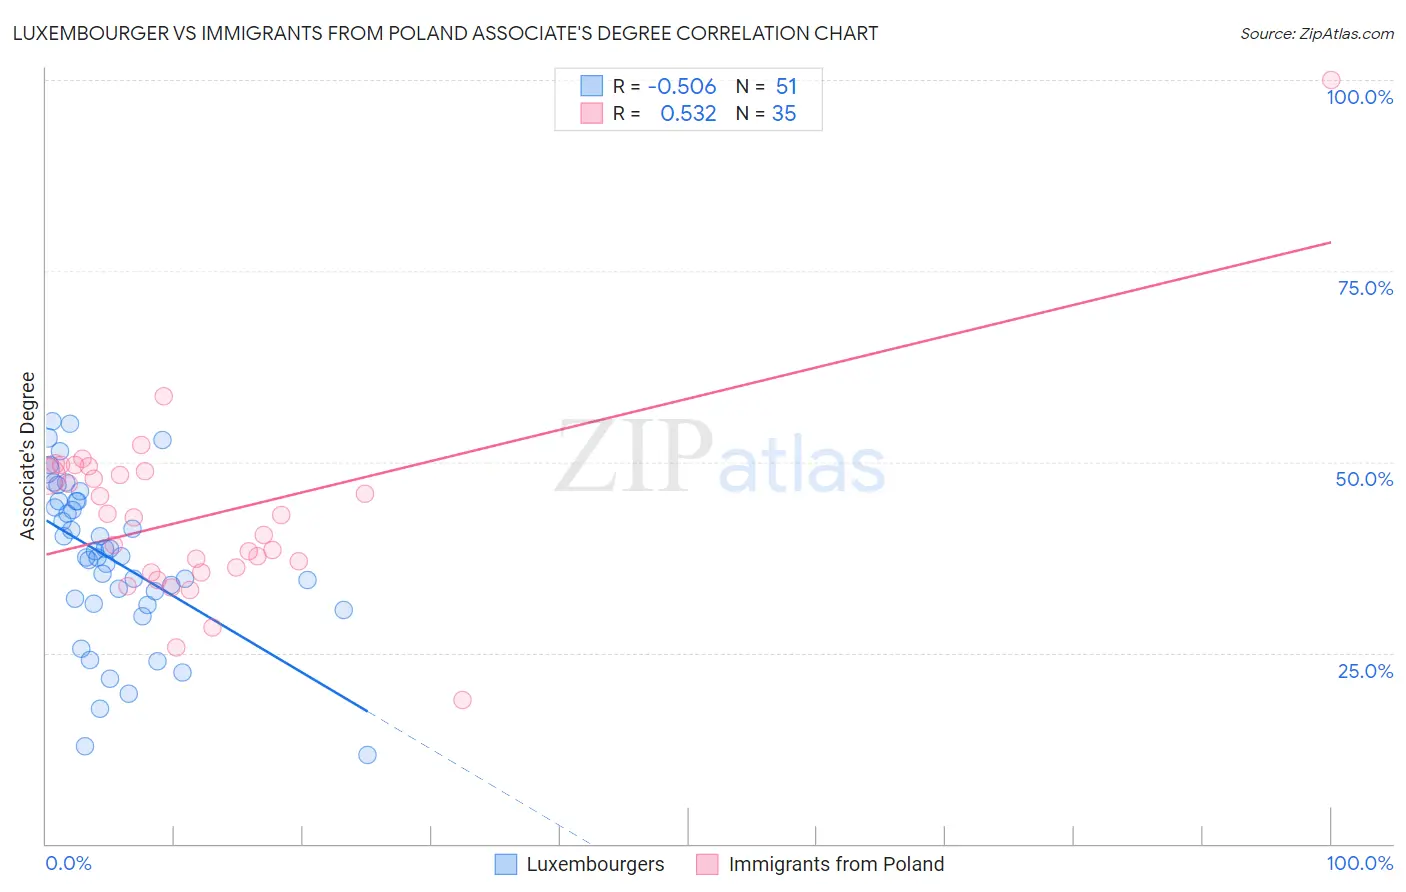
Luxembourger vs Immigrants from Poland Associate's Degree Correlation Chart
The statistical analysis conducted on geographies consisting of 144,669,257 people shows a substantial negative correlation between the proportion of Luxembourgers and percentage of population with at least associate's degree education in the United States with a correlation coefficient (R) of -0.506 and weighted average of 48.9%. Similarly, the statistical analysis conducted on geographies consisting of 304,854,598 people shows a substantial positive correlation between the proportion of Immigrants from Poland and percentage of population with at least associate's degree education in the United States with a correlation coefficient (R) of 0.532 and weighted average of 47.1%, a difference of 4.0%.
Associate's Degree Correlation Summary
| Measurement | Luxembourger | Immigrants from Poland |
| Minimum | 11.7% | 18.8% |
| Maximum | 55.4% | 100.0% |
| Range | 43.7% | 81.2% |
| Mean | 37.3% | 42.9% |
| Median | 37.6% | 42.8% |
| Interquartile 25% (IQ1) | 31.5% | 35.5% |
| Interquartile 75% (IQ3) | 44.8% | 48.8% |
| Interquartile Range (IQR) | 13.3% | 13.2% |
| Standard Deviation (Sample) | 10.5% | 13.0% |
| Standard Deviation (Population) | 10.4% | 12.8% |
Similar Demographics by Associate's Degree
Demographics Similar to Luxembourgers by Associate's Degree
In terms of associate's degree, the demographic groups most similar to Luxembourgers are Immigrants from Chile (49.0%, a difference of 0.070%), Palestinian (49.0%, a difference of 0.070%), Arab (49.0%, a difference of 0.070%), British (48.9%, a difference of 0.070%), and Afghan (48.9%, a difference of 0.11%).
| Demographics | Rating | Rank | Associate's Degree |
| Jordanians | 96.6 /100 | #108 | Exceptional 49.2% |
| Immigrants | Morocco | 96.3 /100 | #109 | Exceptional 49.2% |
| Austrians | 95.8 /100 | #110 | Exceptional 49.1% |
| Immigrants | Venezuela | 95.8 /100 | #111 | Exceptional 49.1% |
| Immigrants | Chile | 95.3 /100 | #112 | Exceptional 49.0% |
| Palestinians | 95.3 /100 | #113 | Exceptional 49.0% |
| Arabs | 95.3 /100 | #114 | Exceptional 49.0% |
| Luxembourgers | 95.1 /100 | #115 | Exceptional 48.9% |
| British | 95.0 /100 | #116 | Exceptional 48.9% |
| Afghans | 94.8 /100 | #117 | Exceptional 48.9% |
| Albanians | 94.7 /100 | #118 | Exceptional 48.8% |
| Lebanese | 94.6 /100 | #119 | Exceptional 48.8% |
| Alsatians | 94.6 /100 | #120 | Exceptional 48.8% |
| Ugandans | 93.9 /100 | #121 | Exceptional 48.7% |
| Italians | 93.9 /100 | #122 | Exceptional 48.7% |
Demographics Similar to Immigrants from Poland by Associate's Degree
In terms of associate's degree, the demographic groups most similar to Immigrants from Poland are Immigrants from Germany (47.1%, a difference of 0.050%), Sudanese (47.1%, a difference of 0.090%), South American (47.1%, a difference of 0.12%), Kenyan (47.1%, a difference of 0.13%), and Immigrants from Kenya (47.2%, a difference of 0.26%).
| Demographics | Rating | Rank | Associate's Degree |
| Immigrants | Afghanistan | 74.3 /100 | #152 | Good 47.3% |
| Czechs | 72.2 /100 | #153 | Good 47.2% |
| Immigrants | Kenya | 72.1 /100 | #154 | Good 47.2% |
| Kenyans | 70.6 /100 | #155 | Good 47.1% |
| South Americans | 70.5 /100 | #156 | Good 47.1% |
| Sudanese | 70.3 /100 | #157 | Good 47.1% |
| Immigrants | Germany | 69.7 /100 | #158 | Good 47.1% |
| Immigrants | Poland | 69.2 /100 | #159 | Good 47.1% |
| Scottish | 65.4 /100 | #160 | Good 46.9% |
| Scandinavians | 65.2 /100 | #161 | Good 46.9% |
| Immigrants | Africa | 63.2 /100 | #162 | Good 46.8% |
| Somalis | 62.5 /100 | #163 | Good 46.8% |
| Colombians | 62.4 /100 | #164 | Good 46.8% |
| Immigrants | South America | 59.9 /100 | #165 | Average 46.7% |
| Hungarians | 59.3 /100 | #166 | Average 46.7% |