Luxembourger vs Bermudan Associate's Degree
COMPARE
Luxembourger
Bermudan
Associate's Degree
Associate's Degree Comparison
Luxembourgers
Bermudans
48.9%
ASSOCIATE'S DEGREE
95.1/ 100
METRIC RATING
115th/ 347
METRIC RANK
46.2%
ASSOCIATE'S DEGREE
46.4/ 100
METRIC RATING
180th/ 347
METRIC RANK
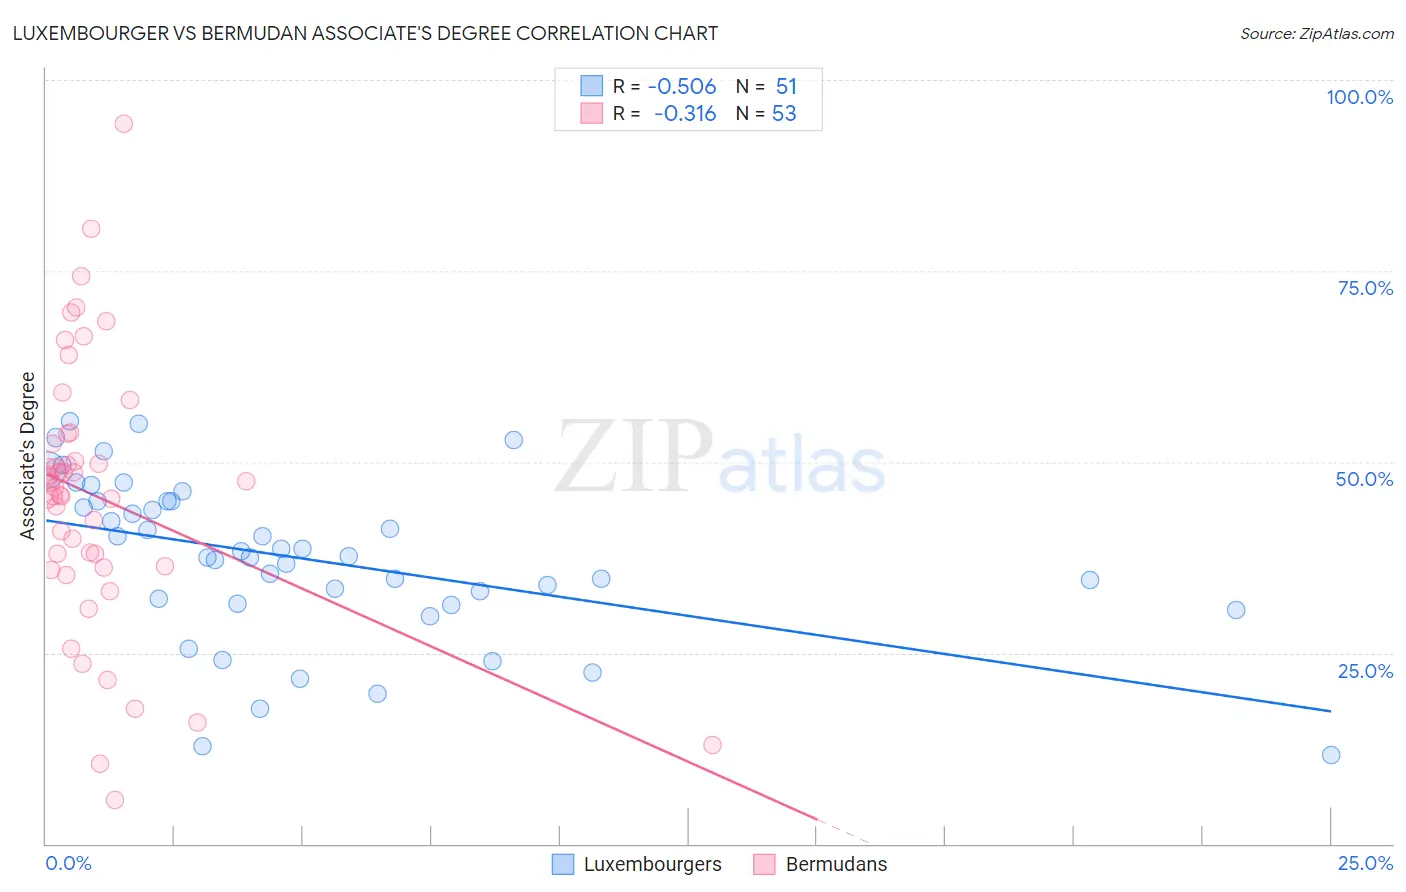
Luxembourger vs Bermudan Associate's Degree Correlation Chart
The statistical analysis conducted on geographies consisting of 144,669,257 people shows a substantial negative correlation between the proportion of Luxembourgers and percentage of population with at least associate's degree education in the United States with a correlation coefficient (R) of -0.506 and weighted average of 48.9%. Similarly, the statistical analysis conducted on geographies consisting of 55,732,793 people shows a mild negative correlation between the proportion of Bermudans and percentage of population with at least associate's degree education in the United States with a correlation coefficient (R) of -0.316 and weighted average of 46.2%, a difference of 5.9%.
Associate's Degree Correlation Summary
| Measurement | Luxembourger | Bermudan |
| Minimum | 11.7% | 5.7% |
| Maximum | 55.4% | 94.2% |
| Range | 43.7% | 88.5% |
| Mean | 37.3% | 45.5% |
| Median | 37.6% | 46.6% |
| Interquartile 25% (IQ1) | 31.5% | 36.2% |
| Interquartile 75% (IQ3) | 44.8% | 53.0% |
| Interquartile Range (IQR) | 13.3% | 16.8% |
| Standard Deviation (Sample) | 10.5% | 17.5% |
| Standard Deviation (Population) | 10.4% | 17.4% |
Similar Demographics by Associate's Degree
Demographics Similar to Luxembourgers by Associate's Degree
In terms of associate's degree, the demographic groups most similar to Luxembourgers are Immigrants from Chile (49.0%, a difference of 0.070%), Palestinian (49.0%, a difference of 0.070%), Arab (49.0%, a difference of 0.070%), British (48.9%, a difference of 0.070%), and Afghan (48.9%, a difference of 0.11%).
| Demographics | Rating | Rank | Associate's Degree |
| Jordanians | 96.6 /100 | #108 | Exceptional 49.2% |
| Immigrants | Morocco | 96.3 /100 | #109 | Exceptional 49.2% |
| Austrians | 95.8 /100 | #110 | Exceptional 49.1% |
| Immigrants | Venezuela | 95.8 /100 | #111 | Exceptional 49.1% |
| Immigrants | Chile | 95.3 /100 | #112 | Exceptional 49.0% |
| Palestinians | 95.3 /100 | #113 | Exceptional 49.0% |
| Arabs | 95.3 /100 | #114 | Exceptional 49.0% |
| Luxembourgers | 95.1 /100 | #115 | Exceptional 48.9% |
| British | 95.0 /100 | #116 | Exceptional 48.9% |
| Afghans | 94.8 /100 | #117 | Exceptional 48.9% |
| Albanians | 94.7 /100 | #118 | Exceptional 48.8% |
| Lebanese | 94.6 /100 | #119 | Exceptional 48.8% |
| Alsatians | 94.6 /100 | #120 | Exceptional 48.8% |
| Ugandans | 93.9 /100 | #121 | Exceptional 48.7% |
| Italians | 93.9 /100 | #122 | Exceptional 48.7% |
Demographics Similar to Bermudans by Associate's Degree
In terms of associate's degree, the demographic groups most similar to Bermudans are Sri Lankan (46.3%, a difference of 0.090%), Immigrants from Bosnia and Herzegovina (46.3%, a difference of 0.14%), Slovak (46.3%, a difference of 0.15%), Finnish (46.3%, a difference of 0.16%), and Belgian (46.3%, a difference of 0.19%).
| Demographics | Rating | Rank | Associate's Degree |
| Immigrants | Iraq | 50.3 /100 | #173 | Average 46.4% |
| English | 50.0 /100 | #174 | Average 46.4% |
| Belgians | 48.9 /100 | #175 | Average 46.3% |
| Finns | 48.5 /100 | #176 | Average 46.3% |
| Slovaks | 48.4 /100 | #177 | Average 46.3% |
| Immigrants | Bosnia and Herzegovina | 48.3 /100 | #178 | Average 46.3% |
| Sri Lankans | 47.6 /100 | #179 | Average 46.3% |
| Bermudans | 46.4 /100 | #180 | Average 46.2% |
| Immigrants | Colombia | 41.3 /100 | #181 | Average 46.0% |
| Swiss | 40.4 /100 | #182 | Average 46.0% |
| Yugoslavians | 40.2 /100 | #183 | Average 46.0% |
| Czechoslovakians | 40.0 /100 | #184 | Average 46.0% |
| Costa Ricans | 38.6 /100 | #185 | Fair 46.0% |
| Welsh | 37.9 /100 | #186 | Fair 45.9% |
| Immigrants | Uruguay | 35.5 /100 | #187 | Fair 45.8% |