Luxembourger vs Immigrants from Cuba No Schooling Completed
COMPARE
Luxembourger
Immigrants from Cuba
No Schooling Completed
No Schooling Completed Comparison
Luxembourgers
Immigrants from Cuba
1.6%
NO SCHOOLING COMPLETED
99.9/ 100
METRIC RATING
40th/ 347
METRIC RANK
2.8%
NO SCHOOLING COMPLETED
0.0/ 100
METRIC RATING
297th/ 347
METRIC RANK
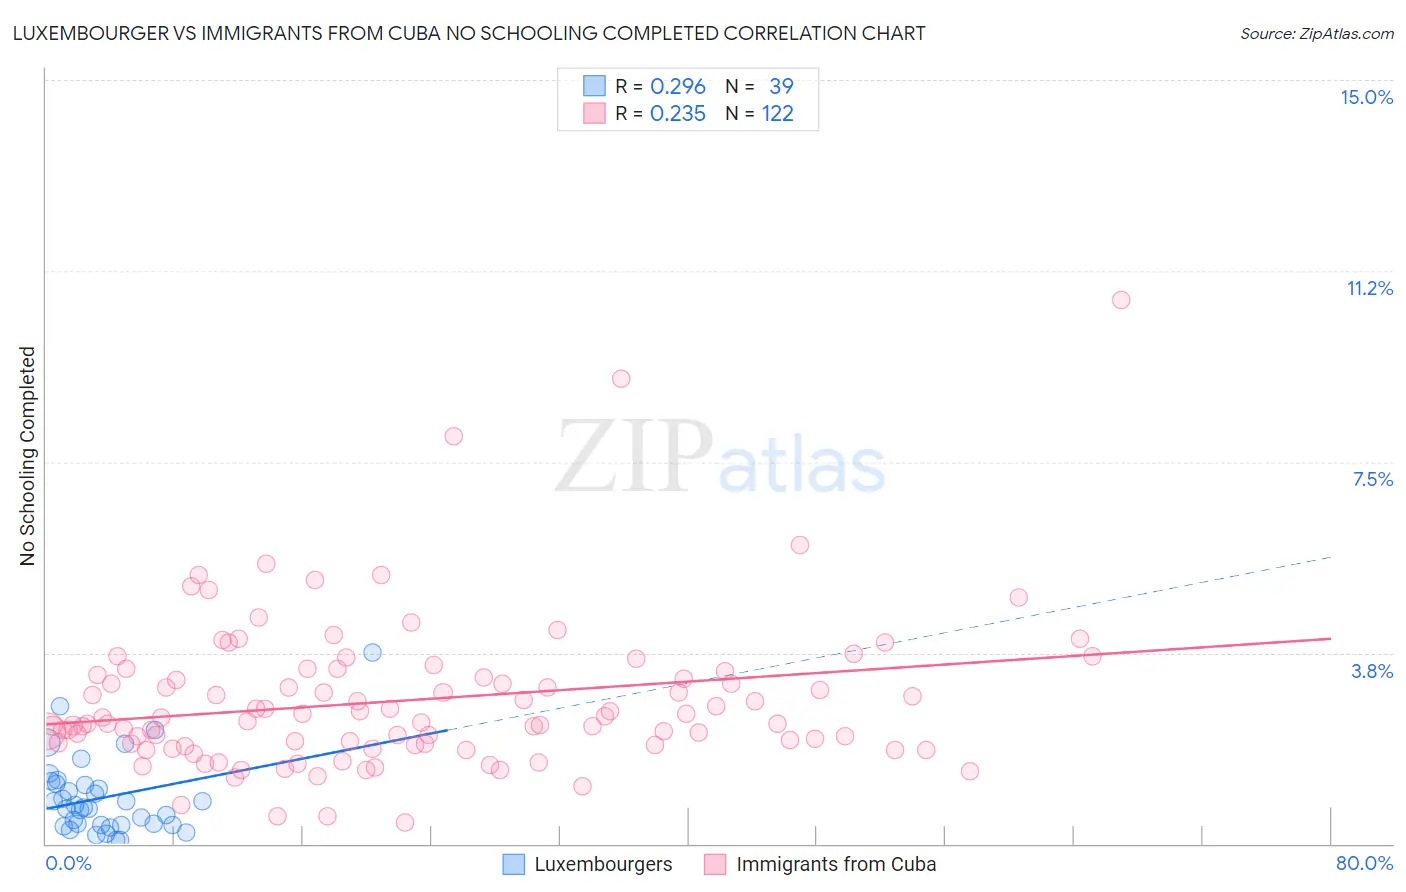
Luxembourger vs Immigrants from Cuba No Schooling Completed Correlation Chart
The statistical analysis conducted on geographies consisting of 143,533,879 people shows a weak positive correlation between the proportion of Luxembourgers and percentage of population with no schooling in the United States with a correlation coefficient (R) of 0.296 and weighted average of 1.6%. Similarly, the statistical analysis conducted on geographies consisting of 324,009,430 people shows a weak positive correlation between the proportion of Immigrants from Cuba and percentage of population with no schooling in the United States with a correlation coefficient (R) of 0.235 and weighted average of 2.8%, a difference of 77.6%.
No Schooling Completed Correlation Summary
| Measurement | Luxembourger | Immigrants from Cuba |
| Minimum | 0.062% | 0.42% |
| Maximum | 3.8% | 10.7% |
| Range | 3.7% | 10.3% |
| Mean | 0.91% | 2.8% |
| Median | 0.71% | 2.5% |
| Interquartile 25% (IQ1) | 0.36% | 2.0% |
| Interquartile 75% (IQ3) | 1.2% | 3.3% |
| Interquartile Range (IQR) | 0.83% | 1.4% |
| Standard Deviation (Sample) | 0.77% | 1.5% |
| Standard Deviation (Population) | 0.76% | 1.5% |
Similar Demographics by No Schooling Completed
Demographics Similar to Luxembourgers by No Schooling Completed
In terms of no schooling completed, the demographic groups most similar to Luxembourgers are Hungarian (1.6%, a difference of 0.27%), Native Hawaiian (1.6%, a difference of 0.35%), Northern European (1.6%, a difference of 0.61%), Belgian (1.6%, a difference of 0.75%), and Aleut (1.6%, a difference of 1.0%).
| Demographics | Rating | Rank | No Schooling Completed |
| Italians | 100.0 /100 | #33 | Exceptional 1.5% |
| Latvians | 100.0 /100 | #34 | Exceptional 1.5% |
| Eastern Europeans | 100.0 /100 | #35 | Exceptional 1.6% |
| Aleuts | 99.9 /100 | #36 | Exceptional 1.6% |
| Belgians | 99.9 /100 | #37 | Exceptional 1.6% |
| Northern Europeans | 99.9 /100 | #38 | Exceptional 1.6% |
| Native Hawaiians | 99.9 /100 | #39 | Exceptional 1.6% |
| Luxembourgers | 99.9 /100 | #40 | Exceptional 1.6% |
| Hungarians | 99.9 /100 | #41 | Exceptional 1.6% |
| Bulgarians | 99.9 /100 | #42 | Exceptional 1.6% |
| Australians | 99.9 /100 | #43 | Exceptional 1.6% |
| Estonians | 99.9 /100 | #44 | Exceptional 1.6% |
| Czechoslovakians | 99.9 /100 | #45 | Exceptional 1.6% |
| Maltese | 99.9 /100 | #46 | Exceptional 1.6% |
| Ottawa | 99.9 /100 | #47 | Exceptional 1.6% |
Demographics Similar to Immigrants from Cuba by No Schooling Completed
In terms of no schooling completed, the demographic groups most similar to Immigrants from Cuba are Immigrants from Dominica (2.8%, a difference of 0.33%), Central American Indian (2.8%, a difference of 0.84%), Immigrants (2.8%, a difference of 1.1%), Haitian (2.9%, a difference of 1.2%), and Houma (2.8%, a difference of 1.3%).
| Demographics | Rating | Rank | No Schooling Completed |
| Immigrants | Hong Kong | 0.0 /100 | #290 | Tragic 2.7% |
| British West Indians | 0.0 /100 | #291 | Tragic 2.7% |
| Immigrants | Grenada | 0.0 /100 | #292 | Tragic 2.8% |
| Malaysians | 0.0 /100 | #293 | Tragic 2.8% |
| Immigrants | Eritrea | 0.0 /100 | #294 | Tragic 2.8% |
| Houma | 0.0 /100 | #295 | Tragic 2.8% |
| Immigrants | Immigrants | 0.0 /100 | #296 | Tragic 2.8% |
| Immigrants | Cuba | 0.0 /100 | #297 | Tragic 2.8% |
| Immigrants | Dominica | 0.0 /100 | #298 | Tragic 2.8% |
| Central American Indians | 0.0 /100 | #299 | Tragic 2.8% |
| Haitians | 0.0 /100 | #300 | Tragic 2.9% |
| Immigrants | South Eastern Asia | 0.0 /100 | #301 | Tragic 2.9% |
| Immigrants | Caribbean | 0.0 /100 | #302 | Tragic 2.9% |
| Somalis | 0.0 /100 | #303 | Tragic 2.9% |
| Nicaraguans | 0.0 /100 | #304 | Tragic 2.9% |