Luxembourger vs Immigrants from Ethiopia No Schooling Completed
COMPARE
Luxembourger
Immigrants from Ethiopia
No Schooling Completed
No Schooling Completed Comparison
Luxembourgers
Immigrants from Ethiopia
1.6%
NO SCHOOLING COMPLETED
99.9/ 100
METRIC RATING
40th/ 347
METRIC RANK
2.5%
NO SCHOOLING COMPLETED
0.6/ 100
METRIC RATING
260th/ 347
METRIC RANK
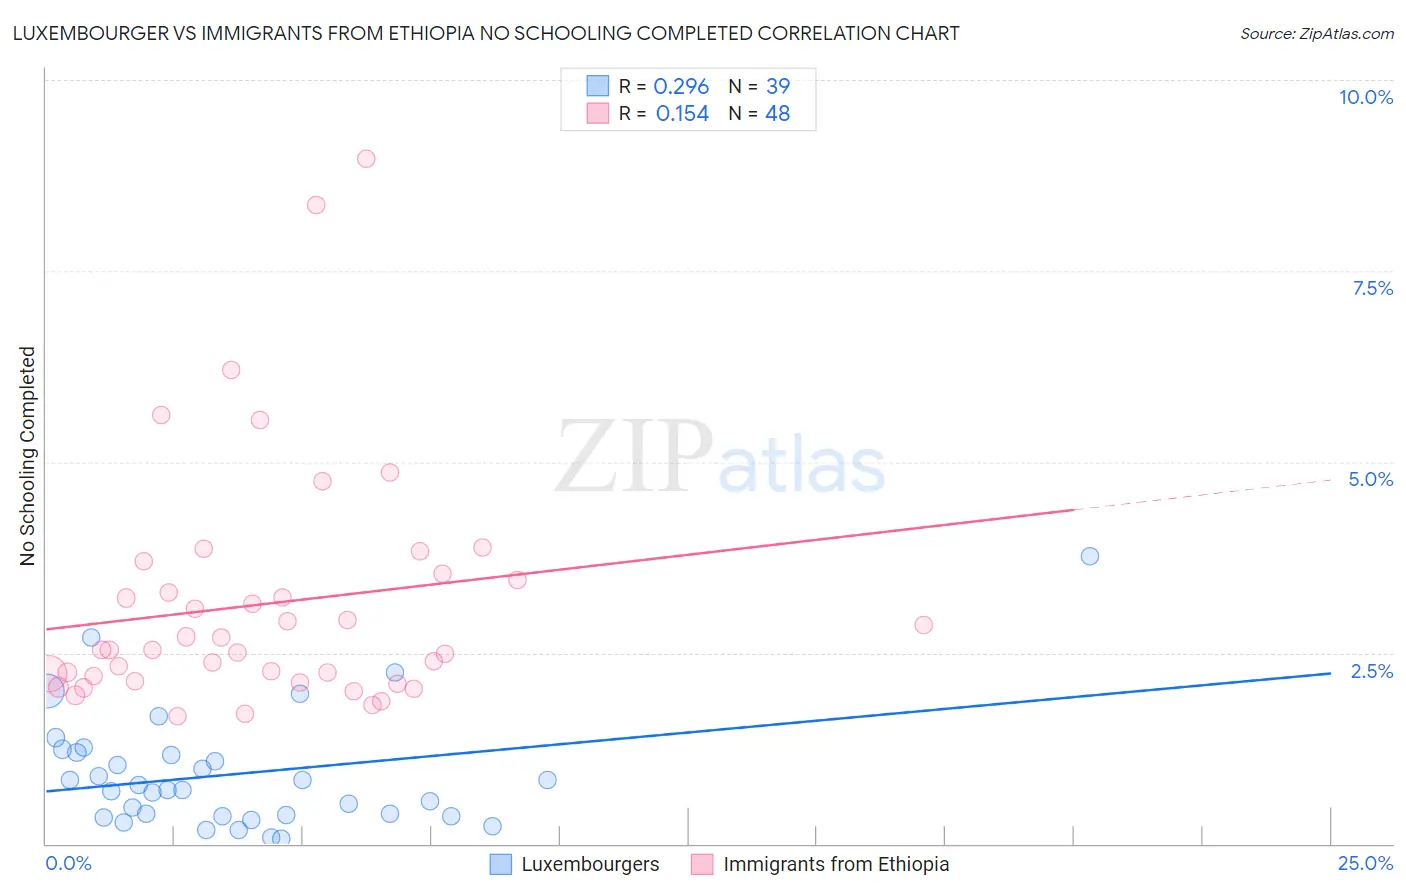
Luxembourger vs Immigrants from Ethiopia No Schooling Completed Correlation Chart
The statistical analysis conducted on geographies consisting of 143,533,879 people shows a weak positive correlation between the proportion of Luxembourgers and percentage of population with no schooling in the United States with a correlation coefficient (R) of 0.296 and weighted average of 1.6%. Similarly, the statistical analysis conducted on geographies consisting of 210,607,771 people shows a poor positive correlation between the proportion of Immigrants from Ethiopia and percentage of population with no schooling in the United States with a correlation coefficient (R) of 0.154 and weighted average of 2.5%, a difference of 54.6%.
No Schooling Completed Correlation Summary
| Measurement | Luxembourger | Immigrants from Ethiopia |
| Minimum | 0.062% | 1.7% |
| Maximum | 3.8% | 9.0% |
| Range | 3.7% | 7.3% |
| Mean | 0.91% | 3.1% |
| Median | 0.71% | 2.5% |
| Interquartile 25% (IQ1) | 0.36% | 2.2% |
| Interquartile 75% (IQ3) | 1.2% | 3.5% |
| Interquartile Range (IQR) | 0.83% | 1.3% |
| Standard Deviation (Sample) | 0.77% | 1.6% |
| Standard Deviation (Population) | 0.76% | 1.6% |
Similar Demographics by No Schooling Completed
Demographics Similar to Luxembourgers by No Schooling Completed
In terms of no schooling completed, the demographic groups most similar to Luxembourgers are Hungarian (1.6%, a difference of 0.27%), Native Hawaiian (1.6%, a difference of 0.35%), Northern European (1.6%, a difference of 0.61%), Belgian (1.6%, a difference of 0.75%), and Aleut (1.6%, a difference of 1.0%).
| Demographics | Rating | Rank | No Schooling Completed |
| Italians | 100.0 /100 | #33 | Exceptional 1.5% |
| Latvians | 100.0 /100 | #34 | Exceptional 1.5% |
| Eastern Europeans | 100.0 /100 | #35 | Exceptional 1.6% |
| Aleuts | 99.9 /100 | #36 | Exceptional 1.6% |
| Belgians | 99.9 /100 | #37 | Exceptional 1.6% |
| Northern Europeans | 99.9 /100 | #38 | Exceptional 1.6% |
| Native Hawaiians | 99.9 /100 | #39 | Exceptional 1.6% |
| Luxembourgers | 99.9 /100 | #40 | Exceptional 1.6% |
| Hungarians | 99.9 /100 | #41 | Exceptional 1.6% |
| Bulgarians | 99.9 /100 | #42 | Exceptional 1.6% |
| Australians | 99.9 /100 | #43 | Exceptional 1.6% |
| Estonians | 99.9 /100 | #44 | Exceptional 1.6% |
| Czechoslovakians | 99.9 /100 | #45 | Exceptional 1.6% |
| Maltese | 99.9 /100 | #46 | Exceptional 1.6% |
| Ottawa | 99.9 /100 | #47 | Exceptional 1.6% |
Demographics Similar to Immigrants from Ethiopia by No Schooling Completed
In terms of no schooling completed, the demographic groups most similar to Immigrants from Ethiopia are Immigrants from Jamaica (2.5%, a difference of 0.050%), Assyrian/Chaldean/Syriac (2.5%, a difference of 0.11%), Armenian (2.5%, a difference of 0.13%), Immigrants from South America (2.5%, a difference of 0.14%), and Immigrants from Sierra Leone (2.5%, a difference of 0.48%).
| Demographics | Rating | Rank | No Schooling Completed |
| Immigrants | Asia | 0.9 /100 | #253 | Tragic 2.4% |
| Immigrants | Eastern Africa | 0.9 /100 | #254 | Tragic 2.4% |
| Ethiopians | 0.8 /100 | #255 | Tragic 2.4% |
| Yaqui | 0.8 /100 | #256 | Tragic 2.4% |
| Immigrants | South America | 0.6 /100 | #257 | Tragic 2.5% |
| Assyrians/Chaldeans/Syriacs | 0.6 /100 | #258 | Tragic 2.5% |
| Immigrants | Jamaica | 0.6 /100 | #259 | Tragic 2.5% |
| Immigrants | Ethiopia | 0.6 /100 | #260 | Tragic 2.5% |
| Armenians | 0.5 /100 | #261 | Tragic 2.5% |
| Immigrants | Sierra Leone | 0.5 /100 | #262 | Tragic 2.5% |
| Immigrants | Liberia | 0.4 /100 | #263 | Tragic 2.5% |
| Indians (Asian) | 0.4 /100 | #264 | Tragic 2.5% |
| West Indians | 0.4 /100 | #265 | Tragic 2.5% |
| Fijians | 0.4 /100 | #266 | Tragic 2.5% |
| Yuman | 0.4 /100 | #267 | Tragic 2.5% |