Luxembourger vs Immigrants from Cuba Nursery School
COMPARE
Luxembourger
Immigrants from Cuba
Nursery School
Nursery School Comparison
Luxembourgers
Immigrants from Cuba
98.5%
NURSERY SCHOOL
99.9/ 100
METRIC RATING
41st/ 347
METRIC RANK
97.2%
NURSERY SCHOOL
0.0/ 100
METRIC RATING
297th/ 347
METRIC RANK
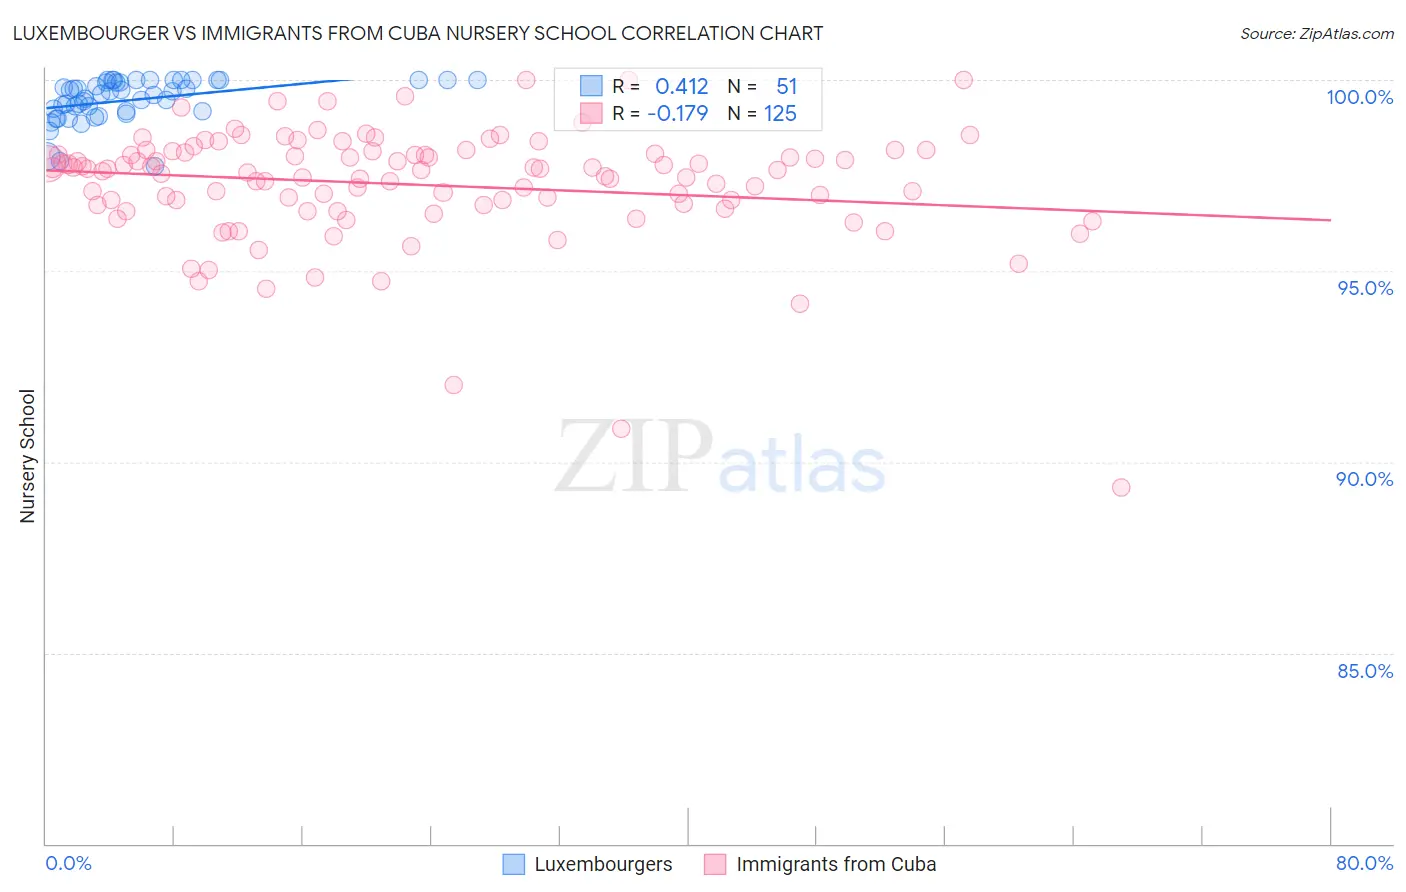
Luxembourger vs Immigrants from Cuba Nursery School Correlation Chart
The statistical analysis conducted on geographies consisting of 144,675,804 people shows a moderate positive correlation between the proportion of Luxembourgers and percentage of population with at least nursery school education in the United States with a correlation coefficient (R) of 0.412 and weighted average of 98.5%. Similarly, the statistical analysis conducted on geographies consisting of 326,028,159 people shows a poor negative correlation between the proportion of Immigrants from Cuba and percentage of population with at least nursery school education in the United States with a correlation coefficient (R) of -0.179 and weighted average of 97.2%, a difference of 1.3%.
Nursery School Correlation Summary
| Measurement | Luxembourger | Immigrants from Cuba |
| Minimum | 97.8% | 89.3% |
| Maximum | 100.0% | 100.0% |
| Range | 2.2% | 10.7% |
| Mean | 99.5% | 97.3% |
| Median | 99.6% | 97.6% |
| Interquartile 25% (IQ1) | 99.2% | 96.7% |
| Interquartile 75% (IQ3) | 100.0% | 98.1% |
| Interquartile Range (IQR) | 0.83% | 1.4% |
| Standard Deviation (Sample) | 0.56% | 1.5% |
| Standard Deviation (Population) | 0.56% | 1.5% |
Similar Demographics by Nursery School
Demographics Similar to Luxembourgers by Nursery School
In terms of nursery school, the demographic groups most similar to Luxembourgers are Eastern European (98.5%, a difference of 0.0%), Latvian (98.5%, a difference of 0.010%), Chippewa (98.5%, a difference of 0.010%), Native Hawaiian (98.5%, a difference of 0.010%), and Belgian (98.5%, a difference of 0.010%).
| Demographics | Rating | Rank | Nursery School |
| Chinese | 100.0 /100 | #34 | Exceptional 98.6% |
| Swiss | 100.0 /100 | #35 | Exceptional 98.6% |
| British | 100.0 /100 | #36 | Exceptional 98.5% |
| Lumbee | 99.9 /100 | #37 | Exceptional 98.5% |
| Italians | 99.9 /100 | #38 | Exceptional 98.5% |
| Latvians | 99.9 /100 | #39 | Exceptional 98.5% |
| Chippewa | 99.9 /100 | #40 | Exceptional 98.5% |
| Luxembourgers | 99.9 /100 | #41 | Exceptional 98.5% |
| Eastern Europeans | 99.9 /100 | #42 | Exceptional 98.5% |
| Native Hawaiians | 99.9 /100 | #43 | Exceptional 98.5% |
| Belgians | 99.9 /100 | #44 | Exceptional 98.5% |
| Northern Europeans | 99.9 /100 | #45 | Exceptional 98.5% |
| Hungarians | 99.9 /100 | #46 | Exceptional 98.5% |
| Czechoslovakians | 99.9 /100 | #47 | Exceptional 98.5% |
| Ottawa | 99.8 /100 | #48 | Exceptional 98.5% |
Demographics Similar to Immigrants from Cuba by Nursery School
In terms of nursery school, the demographic groups most similar to Immigrants from Cuba are Central American Indian (97.2%, a difference of 0.010%), Immigrants from Dominica (97.2%, a difference of 0.010%), Haitian (97.2%, a difference of 0.030%), Immigrants from Eritrea (97.2%, a difference of 0.040%), and Immigrants (97.2%, a difference of 0.050%).
| Demographics | Rating | Rank | Nursery School |
| Immigrants | Afghanistan | 0.0 /100 | #290 | Tragic 97.3% |
| British West Indians | 0.0 /100 | #291 | Tragic 97.3% |
| Houma | 0.0 /100 | #292 | Tragic 97.3% |
| Malaysians | 0.0 /100 | #293 | Tragic 97.3% |
| Immigrants | Grenada | 0.0 /100 | #294 | Tragic 97.3% |
| Immigrants | Immigrants | 0.0 /100 | #295 | Tragic 97.2% |
| Immigrants | Eritrea | 0.0 /100 | #296 | Tragic 97.2% |
| Immigrants | Cuba | 0.0 /100 | #297 | Tragic 97.2% |
| Central American Indians | 0.0 /100 | #298 | Tragic 97.2% |
| Immigrants | Dominica | 0.0 /100 | #299 | Tragic 97.2% |
| Haitians | 0.0 /100 | #300 | Tragic 97.2% |
| Immigrants | South Eastern Asia | 0.0 /100 | #301 | Tragic 97.1% |
| Immigrants | Caribbean | 0.0 /100 | #302 | Tragic 97.1% |
| Nicaraguans | 0.0 /100 | #303 | Tragic 97.1% |
| Ecuadorians | 0.0 /100 | #304 | Tragic 97.1% |