Immigrants from France vs Immigrants from Cuba No Schooling Completed
COMPARE
Immigrants from France
Immigrants from Cuba
No Schooling Completed
No Schooling Completed Comparison
Immigrants from France
Immigrants from Cuba
1.8%
NO SCHOOLING COMPLETED
97.3/ 100
METRIC RATING
106th/ 347
METRIC RANK
2.8%
NO SCHOOLING COMPLETED
0.0/ 100
METRIC RATING
297th/ 347
METRIC RANK
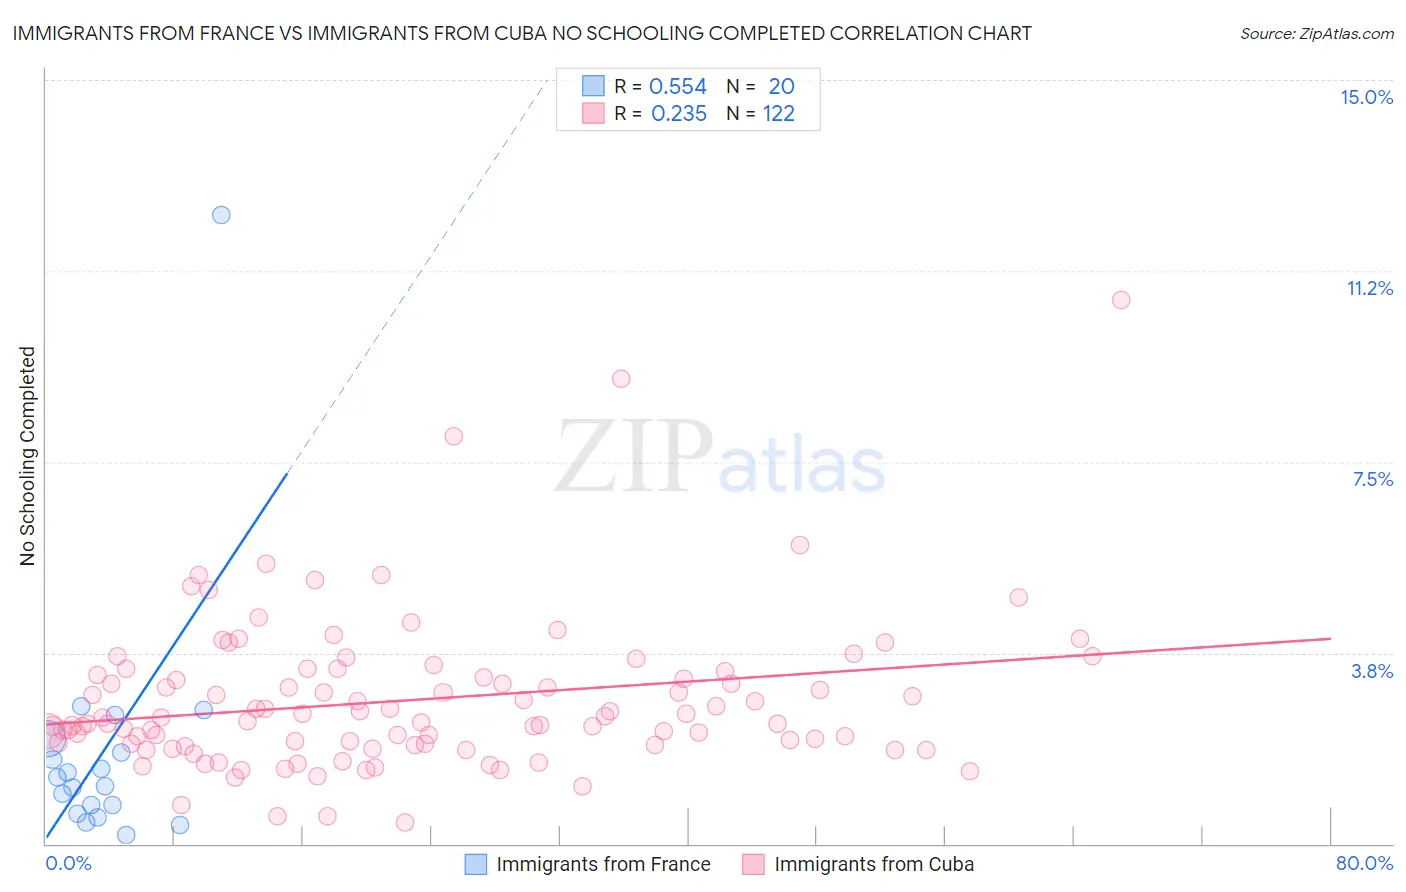
Immigrants from France vs Immigrants from Cuba No Schooling Completed Correlation Chart
The statistical analysis conducted on geographies consisting of 285,710,954 people shows a substantial positive correlation between the proportion of Immigrants from France and percentage of population with no schooling in the United States with a correlation coefficient (R) of 0.554 and weighted average of 1.8%. Similarly, the statistical analysis conducted on geographies consisting of 324,009,430 people shows a weak positive correlation between the proportion of Immigrants from Cuba and percentage of population with no schooling in the United States with a correlation coefficient (R) of 0.235 and weighted average of 2.8%, a difference of 53.2%.
No Schooling Completed Correlation Summary
| Measurement | Immigrants from France | Immigrants from Cuba |
| Minimum | 0.17% | 0.42% |
| Maximum | 12.3% | 10.7% |
| Range | 12.2% | 10.3% |
| Mean | 1.8% | 2.8% |
| Median | 1.2% | 2.5% |
| Interquartile 25% (IQ1) | 0.68% | 2.0% |
| Interquartile 75% (IQ3) | 1.9% | 3.3% |
| Interquartile Range (IQR) | 1.2% | 1.4% |
| Standard Deviation (Sample) | 2.6% | 1.5% |
| Standard Deviation (Population) | 2.5% | 1.5% |
Similar Demographics by No Schooling Completed
Demographics Similar to Immigrants from France by No Schooling Completed
In terms of no schooling completed, the demographic groups most similar to Immigrants from France are Yugoslavian (1.8%, a difference of 0.040%), Okinawan (1.8%, a difference of 0.26%), German Russian (1.8%, a difference of 0.40%), Thai (1.8%, a difference of 0.42%), and Immigrants from Saudi Arabia (1.9%, a difference of 0.60%).
| Demographics | Rating | Rank | No Schooling Completed |
| Choctaw | 98.1 /100 | #99 | Exceptional 1.8% |
| Immigrants | Singapore | 98.0 /100 | #100 | Exceptional 1.8% |
| Immigrants | Czechoslovakia | 97.9 /100 | #101 | Exceptional 1.8% |
| Immigrants | Switzerland | 97.9 /100 | #102 | Exceptional 1.8% |
| Basques | 97.9 /100 | #103 | Exceptional 1.8% |
| Thais | 97.5 /100 | #104 | Exceptional 1.8% |
| German Russians | 97.5 /100 | #105 | Exceptional 1.8% |
| Immigrants | France | 97.3 /100 | #106 | Exceptional 1.8% |
| Yugoslavians | 97.2 /100 | #107 | Exceptional 1.8% |
| Okinawans | 97.1 /100 | #108 | Exceptional 1.8% |
| Immigrants | Saudi Arabia | 96.8 /100 | #109 | Exceptional 1.9% |
| Immigrants | Latvia | 96.7 /100 | #110 | Exceptional 1.9% |
| Immigrants | Japan | 96.6 /100 | #111 | Exceptional 1.9% |
| Pueblo | 96.4 /100 | #112 | Exceptional 1.9% |
| Immigrants | Zimbabwe | 96.2 /100 | #113 | Exceptional 1.9% |
Demographics Similar to Immigrants from Cuba by No Schooling Completed
In terms of no schooling completed, the demographic groups most similar to Immigrants from Cuba are Immigrants from Dominica (2.8%, a difference of 0.33%), Central American Indian (2.8%, a difference of 0.84%), Immigrants (2.8%, a difference of 1.1%), Haitian (2.9%, a difference of 1.2%), and Houma (2.8%, a difference of 1.3%).
| Demographics | Rating | Rank | No Schooling Completed |
| Immigrants | Hong Kong | 0.0 /100 | #290 | Tragic 2.7% |
| British West Indians | 0.0 /100 | #291 | Tragic 2.7% |
| Immigrants | Grenada | 0.0 /100 | #292 | Tragic 2.8% |
| Malaysians | 0.0 /100 | #293 | Tragic 2.8% |
| Immigrants | Eritrea | 0.0 /100 | #294 | Tragic 2.8% |
| Houma | 0.0 /100 | #295 | Tragic 2.8% |
| Immigrants | Immigrants | 0.0 /100 | #296 | Tragic 2.8% |
| Immigrants | Cuba | 0.0 /100 | #297 | Tragic 2.8% |
| Immigrants | Dominica | 0.0 /100 | #298 | Tragic 2.8% |
| Central American Indians | 0.0 /100 | #299 | Tragic 2.8% |
| Haitians | 0.0 /100 | #300 | Tragic 2.9% |
| Immigrants | South Eastern Asia | 0.0 /100 | #301 | Tragic 2.9% |
| Immigrants | Caribbean | 0.0 /100 | #302 | Tragic 2.9% |
| Somalis | 0.0 /100 | #303 | Tragic 2.9% |
| Nicaraguans | 0.0 /100 | #304 | Tragic 2.9% |