Luxembourger vs Jordanian No Schooling Completed
COMPARE
Luxembourger
Jordanian
No Schooling Completed
No Schooling Completed Comparison
Luxembourgers
Jordanians
1.6%
NO SCHOOLING COMPLETED
99.9/ 100
METRIC RATING
40th/ 347
METRIC RANK
2.0%
NO SCHOOLING COMPLETED
84.5/ 100
METRIC RATING
139th/ 347
METRIC RANK
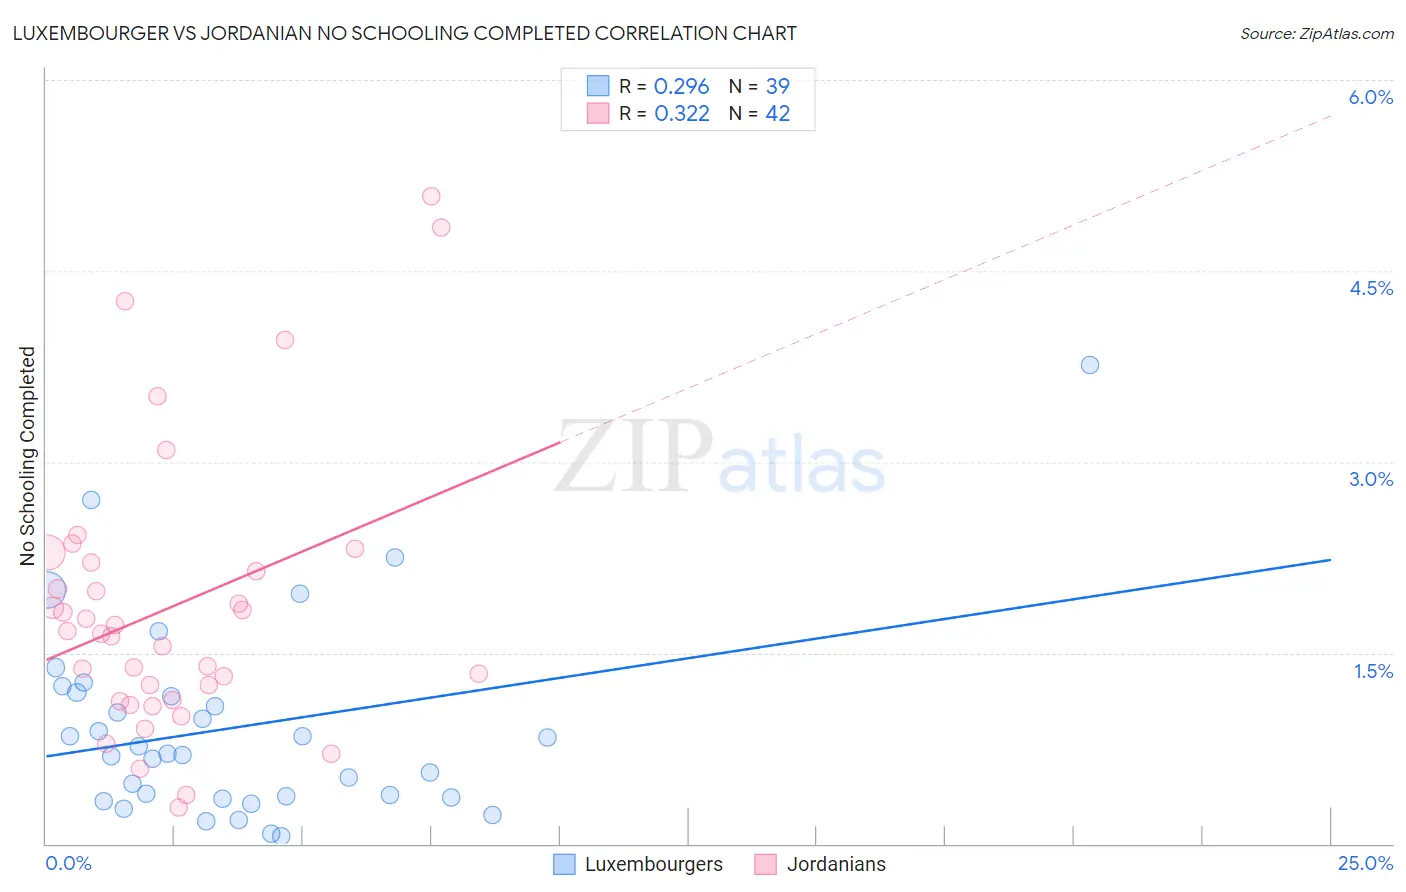
Luxembourger vs Jordanian No Schooling Completed Correlation Chart
The statistical analysis conducted on geographies consisting of 143,533,879 people shows a weak positive correlation between the proportion of Luxembourgers and percentage of population with no schooling in the United States with a correlation coefficient (R) of 0.296 and weighted average of 1.6%. Similarly, the statistical analysis conducted on geographies consisting of 166,048,853 people shows a mild positive correlation between the proportion of Jordanians and percentage of population with no schooling in the United States with a correlation coefficient (R) of 0.322 and weighted average of 2.0%, a difference of 24.1%.
No Schooling Completed Correlation Summary
| Measurement | Luxembourger | Jordanian |
| Minimum | 0.062% | 0.29% |
| Maximum | 3.8% | 5.1% |
| Range | 3.7% | 4.8% |
| Mean | 0.91% | 1.9% |
| Median | 0.71% | 1.7% |
| Interquartile 25% (IQ1) | 0.36% | 1.1% |
| Interquartile 75% (IQ3) | 1.2% | 2.2% |
| Interquartile Range (IQR) | 0.83% | 1.1% |
| Standard Deviation (Sample) | 0.77% | 1.1% |
| Standard Deviation (Population) | 0.76% | 1.1% |
Similar Demographics by No Schooling Completed
Demographics Similar to Luxembourgers by No Schooling Completed
In terms of no schooling completed, the demographic groups most similar to Luxembourgers are Hungarian (1.6%, a difference of 0.27%), Native Hawaiian (1.6%, a difference of 0.35%), Northern European (1.6%, a difference of 0.61%), Belgian (1.6%, a difference of 0.75%), and Aleut (1.6%, a difference of 1.0%).
| Demographics | Rating | Rank | No Schooling Completed |
| Italians | 100.0 /100 | #33 | Exceptional 1.5% |
| Latvians | 100.0 /100 | #34 | Exceptional 1.5% |
| Eastern Europeans | 100.0 /100 | #35 | Exceptional 1.6% |
| Aleuts | 99.9 /100 | #36 | Exceptional 1.6% |
| Belgians | 99.9 /100 | #37 | Exceptional 1.6% |
| Northern Europeans | 99.9 /100 | #38 | Exceptional 1.6% |
| Native Hawaiians | 99.9 /100 | #39 | Exceptional 1.6% |
| Luxembourgers | 99.9 /100 | #40 | Exceptional 1.6% |
| Hungarians | 99.9 /100 | #41 | Exceptional 1.6% |
| Bulgarians | 99.9 /100 | #42 | Exceptional 1.6% |
| Australians | 99.9 /100 | #43 | Exceptional 1.6% |
| Estonians | 99.9 /100 | #44 | Exceptional 1.6% |
| Czechoslovakians | 99.9 /100 | #45 | Exceptional 1.6% |
| Maltese | 99.9 /100 | #46 | Exceptional 1.6% |
| Ottawa | 99.9 /100 | #47 | Exceptional 1.6% |
Demographics Similar to Jordanians by No Schooling Completed
In terms of no schooling completed, the demographic groups most similar to Jordanians are Immigrants from Israel (2.0%, a difference of 0.25%), Marshallese (2.0%, a difference of 0.26%), Immigrants from Greece (2.0%, a difference of 0.27%), Filipino (2.0%, a difference of 0.29%), and Venezuelan (2.0%, a difference of 0.76%).
| Demographics | Rating | Rank | No Schooling Completed |
| Colville | 90.4 /100 | #132 | Exceptional 1.9% |
| Immigrants | Turkey | 90.2 /100 | #133 | Exceptional 1.9% |
| Menominee | 89.6 /100 | #134 | Excellent 1.9% |
| Hmong | 88.5 /100 | #135 | Excellent 1.9% |
| Burmese | 88.2 /100 | #136 | Excellent 1.9% |
| Filipinos | 85.5 /100 | #137 | Excellent 2.0% |
| Immigrants | Israel | 85.4 /100 | #138 | Excellent 2.0% |
| Jordanians | 84.5 /100 | #139 | Excellent 2.0% |
| Marshallese | 83.5 /100 | #140 | Excellent 2.0% |
| Immigrants | Greece | 83.5 /100 | #141 | Excellent 2.0% |
| Venezuelans | 81.5 /100 | #142 | Excellent 2.0% |
| Immigrants | South Central Asia | 80.0 /100 | #143 | Good 2.0% |
| Alsatians | 79.1 /100 | #144 | Good 2.0% |
| Immigrants | Iran | 79.0 /100 | #145 | Good 2.0% |
| Immigrants | Moldova | 78.0 /100 | #146 | Good 2.0% |