Luxembourger vs Spaniard No Schooling Completed
COMPARE
Luxembourger
Spaniard
No Schooling Completed
No Schooling Completed Comparison
Luxembourgers
Spaniards
1.6%
NO SCHOOLING COMPLETED
99.9/ 100
METRIC RATING
40th/ 347
METRIC RANK
1.9%
NO SCHOOLING COMPLETED
92.3/ 100
METRIC RATING
128th/ 347
METRIC RANK
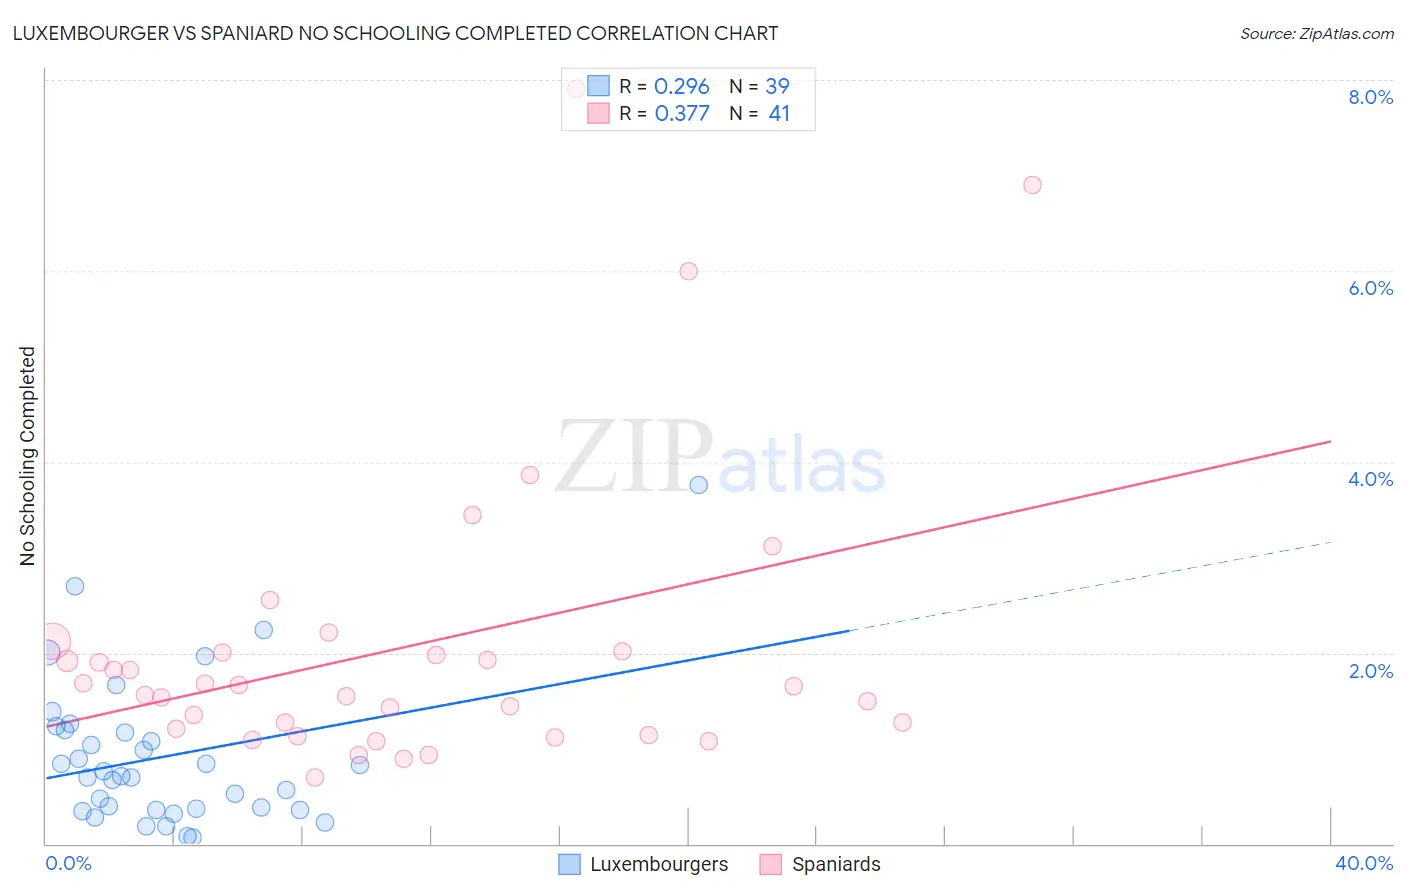
Luxembourger vs Spaniard No Schooling Completed Correlation Chart
The statistical analysis conducted on geographies consisting of 143,533,879 people shows a weak positive correlation between the proportion of Luxembourgers and percentage of population with no schooling in the United States with a correlation coefficient (R) of 0.296 and weighted average of 1.6%. Similarly, the statistical analysis conducted on geographies consisting of 437,809,965 people shows a mild positive correlation between the proportion of Spaniards and percentage of population with no schooling in the United States with a correlation coefficient (R) of 0.377 and weighted average of 1.9%, a difference of 20.7%.
No Schooling Completed Correlation Summary
| Measurement | Luxembourger | Spaniard |
| Minimum | 0.062% | 0.69% |
| Maximum | 3.8% | 7.9% |
| Range | 3.7% | 7.2% |
| Mean | 0.91% | 2.1% |
| Median | 0.71% | 1.7% |
| Interquartile 25% (IQ1) | 0.36% | 1.2% |
| Interquartile 75% (IQ3) | 1.2% | 2.0% |
| Interquartile Range (IQR) | 0.83% | 0.84% |
| Standard Deviation (Sample) | 0.77% | 1.6% |
| Standard Deviation (Population) | 0.76% | 1.5% |
Similar Demographics by No Schooling Completed
Demographics Similar to Luxembourgers by No Schooling Completed
In terms of no schooling completed, the demographic groups most similar to Luxembourgers are Hungarian (1.6%, a difference of 0.27%), Native Hawaiian (1.6%, a difference of 0.35%), Northern European (1.6%, a difference of 0.61%), Belgian (1.6%, a difference of 0.75%), and Aleut (1.6%, a difference of 1.0%).
| Demographics | Rating | Rank | No Schooling Completed |
| Italians | 100.0 /100 | #33 | Exceptional 1.5% |
| Latvians | 100.0 /100 | #34 | Exceptional 1.5% |
| Eastern Europeans | 100.0 /100 | #35 | Exceptional 1.6% |
| Aleuts | 99.9 /100 | #36 | Exceptional 1.6% |
| Belgians | 99.9 /100 | #37 | Exceptional 1.6% |
| Northern Europeans | 99.9 /100 | #38 | Exceptional 1.6% |
| Native Hawaiians | 99.9 /100 | #39 | Exceptional 1.6% |
| Luxembourgers | 99.9 /100 | #40 | Exceptional 1.6% |
| Hungarians | 99.9 /100 | #41 | Exceptional 1.6% |
| Bulgarians | 99.9 /100 | #42 | Exceptional 1.6% |
| Australians | 99.9 /100 | #43 | Exceptional 1.6% |
| Estonians | 99.9 /100 | #44 | Exceptional 1.6% |
| Czechoslovakians | 99.9 /100 | #45 | Exceptional 1.6% |
| Maltese | 99.9 /100 | #46 | Exceptional 1.6% |
| Ottawa | 99.9 /100 | #47 | Exceptional 1.6% |
Demographics Similar to Spaniards by No Schooling Completed
In terms of no schooling completed, the demographic groups most similar to Spaniards are Israeli (1.9%, a difference of 0.090%), Seminole (1.9%, a difference of 0.14%), Immigrants from Romania (1.9%, a difference of 0.15%), Palestinian (1.9%, a difference of 0.25%), and Immigrants from Hungary (1.9%, a difference of 0.35%).
| Demographics | Rating | Rank | No Schooling Completed |
| Immigrants | Croatia | 94.5 /100 | #121 | Exceptional 1.9% |
| Cree | 94.5 /100 | #122 | Exceptional 1.9% |
| Immigrants | Kuwait | 93.9 /100 | #123 | Exceptional 1.9% |
| Cambodians | 93.8 /100 | #124 | Exceptional 1.9% |
| Immigrants | Europe | 93.7 /100 | #125 | Exceptional 1.9% |
| Immigrants | Romania | 92.6 /100 | #126 | Exceptional 1.9% |
| Israelis | 92.4 /100 | #127 | Exceptional 1.9% |
| Spaniards | 92.3 /100 | #128 | Exceptional 1.9% |
| Seminole | 92.0 /100 | #129 | Exceptional 1.9% |
| Palestinians | 91.8 /100 | #130 | Exceptional 1.9% |
| Immigrants | Hungary | 91.6 /100 | #131 | Exceptional 1.9% |
| Colville | 90.4 /100 | #132 | Exceptional 1.9% |
| Immigrants | Turkey | 90.2 /100 | #133 | Exceptional 1.9% |
| Menominee | 89.6 /100 | #134 | Excellent 1.9% |
| Hmong | 88.5 /100 | #135 | Excellent 1.9% |