Lumbee vs Mexican 11th Grade
COMPARE
Lumbee
Mexican
11th Grade
11th Grade Comparison
Lumbee
Mexicans
88.9%
11TH GRADE
0.0/ 100
METRIC RATING
317th/ 347
METRIC RANK
86.1%
11TH GRADE
0.0/ 100
METRIC RATING
341st/ 347
METRIC RANK
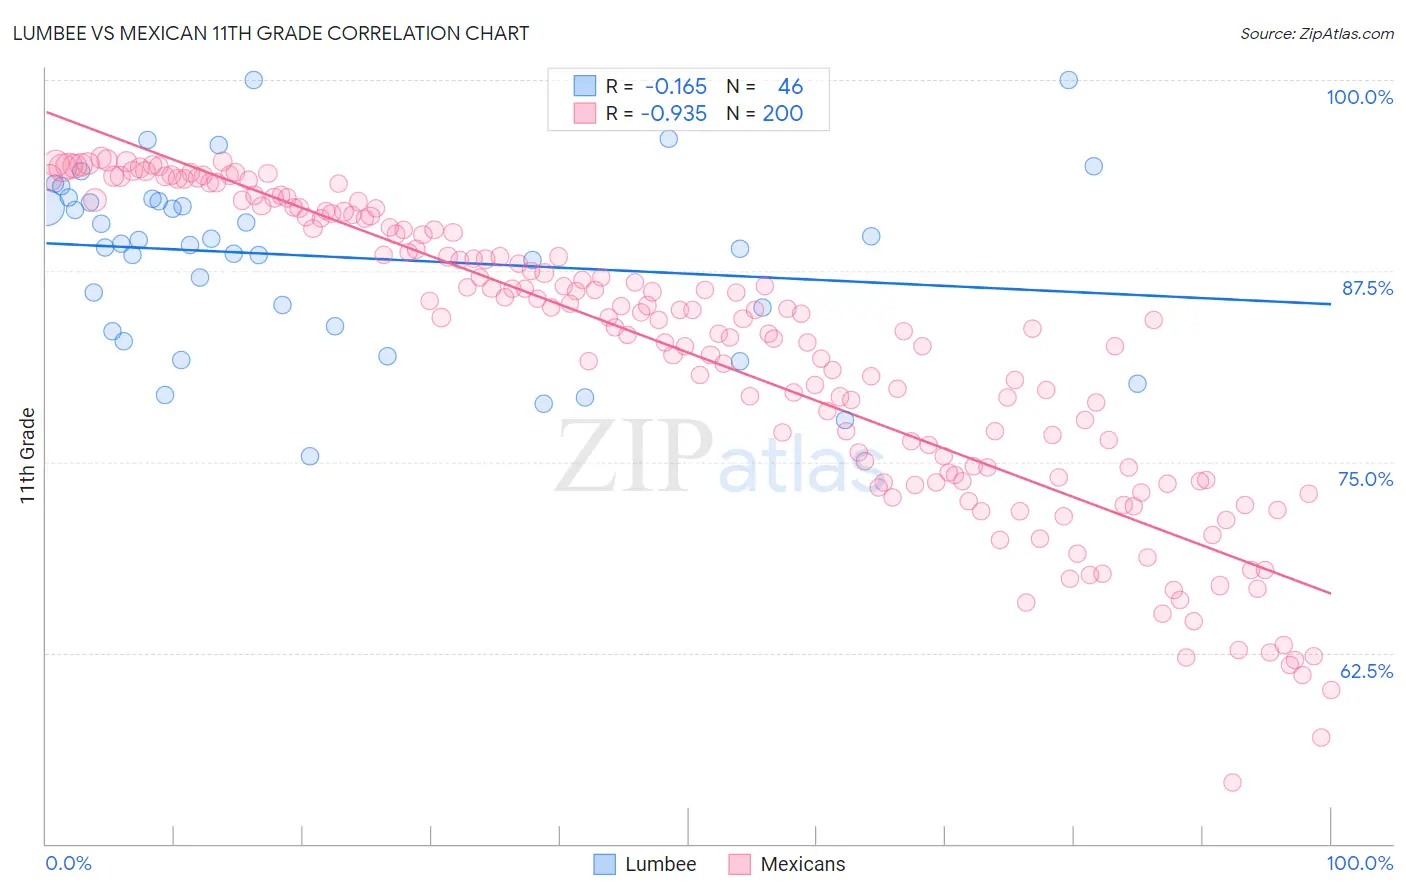
Lumbee vs Mexican 11th Grade Correlation Chart
The statistical analysis conducted on geographies consisting of 92,299,068 people shows a poor negative correlation between the proportion of Lumbee and percentage of population with at least 11th grade education in the United States with a correlation coefficient (R) of -0.165 and weighted average of 88.9%. Similarly, the statistical analysis conducted on geographies consisting of 565,338,951 people shows a near-perfect negative correlation between the proportion of Mexicans and percentage of population with at least 11th grade education in the United States with a correlation coefficient (R) of -0.935 and weighted average of 86.1%, a difference of 3.3%.
11th Grade Correlation Summary
| Measurement | Lumbee | Mexican |
| Minimum | 75.4% | 54.0% |
| Maximum | 100.0% | 94.9% |
| Range | 24.6% | 40.9% |
| Mean | 88.4% | 82.1% |
| Median | 89.2% | 84.4% |
| Interquartile 25% (IQ1) | 83.9% | 74.2% |
| Interquartile 75% (IQ3) | 92.1% | 90.9% |
| Interquartile Range (IQR) | 8.2% | 16.7% |
| Standard Deviation (Sample) | 5.8% | 9.8% |
| Standard Deviation (Population) | 5.7% | 9.7% |
Similar Demographics by 11th Grade
Demographics Similar to Lumbee by 11th Grade
In terms of 11th grade, the demographic groups most similar to Lumbee are Immigrants from Cuba (88.9%, a difference of 0.010%), Nicaraguan (88.9%, a difference of 0.060%), Belizean (88.8%, a difference of 0.15%), Immigrants from Ecuador (89.1%, a difference of 0.16%), and Cape Verdean (89.1%, a difference of 0.17%).
| Demographics | Rating | Rank | 11th Grade |
| Yaqui | 0.0 /100 | #310 | Tragic 89.5% |
| Vietnamese | 0.0 /100 | #311 | Tragic 89.4% |
| Immigrants | Portugal | 0.0 /100 | #312 | Tragic 89.3% |
| Immigrants | Caribbean | 0.0 /100 | #313 | Tragic 89.1% |
| Cape Verdeans | 0.0 /100 | #314 | Tragic 89.1% |
| Immigrants | Ecuador | 0.0 /100 | #315 | Tragic 89.1% |
| Immigrants | Cuba | 0.0 /100 | #316 | Tragic 88.9% |
| Lumbee | 0.0 /100 | #317 | Tragic 88.9% |
| Nicaraguans | 0.0 /100 | #318 | Tragic 88.9% |
| Belizeans | 0.0 /100 | #319 | Tragic 88.8% |
| Immigrants | Armenia | 0.0 /100 | #320 | Tragic 88.8% |
| Immigrants | Belize | 0.0 /100 | #321 | Tragic 88.7% |
| Puerto Ricans | 0.0 /100 | #322 | Tragic 88.4% |
| Pima | 0.0 /100 | #323 | Tragic 88.3% |
| Central American Indians | 0.0 /100 | #324 | Tragic 88.2% |
Demographics Similar to Mexicans by 11th Grade
In terms of 11th grade, the demographic groups most similar to Mexicans are Salvadoran (86.2%, a difference of 0.060%), Guatemalan (86.4%, a difference of 0.29%), Immigrants from Guatemala (85.8%, a difference of 0.33%), Immigrants from Latin America (86.8%, a difference of 0.78%), and Immigrants from Dominican Republic (86.9%, a difference of 0.91%).
| Demographics | Rating | Rank | 11th Grade |
| Immigrants | Yemen | 0.0 /100 | #333 | Tragic 87.1% |
| Houma | 0.0 /100 | #334 | Tragic 87.0% |
| Central Americans | 0.0 /100 | #335 | Tragic 86.9% |
| Immigrants | Dominican Republic | 0.0 /100 | #336 | Tragic 86.9% |
| Immigrants | Honduras | 0.0 /100 | #337 | Tragic 86.9% |
| Immigrants | Latin America | 0.0 /100 | #338 | Tragic 86.8% |
| Guatemalans | 0.0 /100 | #339 | Tragic 86.4% |
| Salvadorans | 0.0 /100 | #340 | Tragic 86.2% |
| Mexicans | 0.0 /100 | #341 | Tragic 86.1% |
| Immigrants | Guatemala | 0.0 /100 | #342 | Tragic 85.8% |
| Immigrants | El Salvador | 0.0 /100 | #343 | Tragic 85.3% |
| Yakama | 0.0 /100 | #344 | Tragic 85.0% |
| Immigrants | Central America | 0.0 /100 | #345 | Tragic 84.9% |
| Spanish American Indians | 0.0 /100 | #346 | Tragic 84.7% |
| Immigrants | Mexico | 0.0 /100 | #347 | Tragic 84.5% |