Lumbee vs Immigrants from Ethiopia 11th Grade
COMPARE
Lumbee
Immigrants from Ethiopia
11th Grade
11th Grade Comparison
Lumbee
Immigrants from Ethiopia
88.9%
11TH GRADE
0.0/ 100
METRIC RATING
317th/ 347
METRIC RANK
92.1%
11TH GRADE
13.9/ 100
METRIC RATING
213th/ 347
METRIC RANK
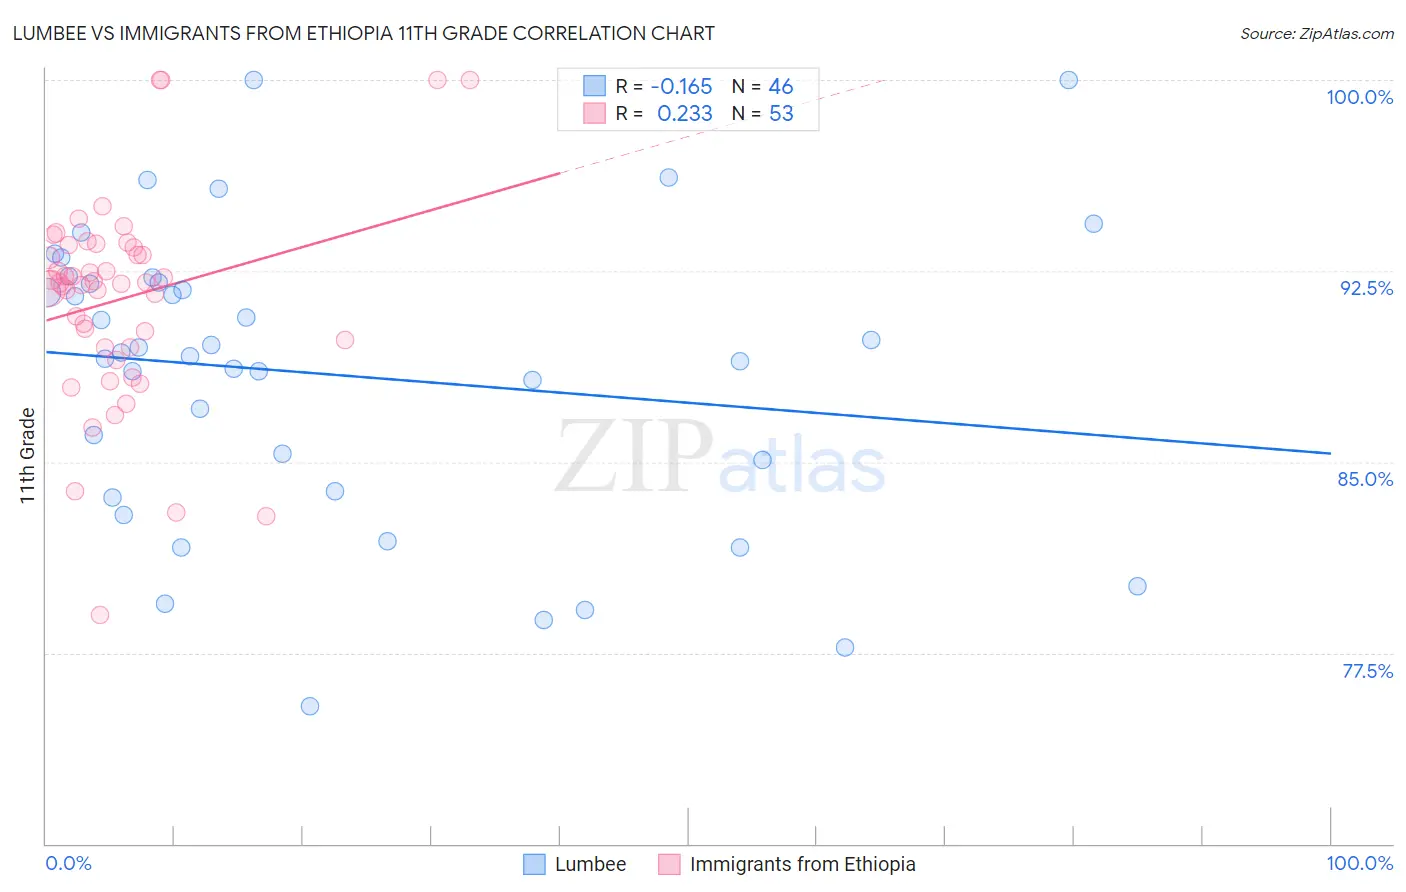
Lumbee vs Immigrants from Ethiopia 11th Grade Correlation Chart
The statistical analysis conducted on geographies consisting of 92,299,068 people shows a poor negative correlation between the proportion of Lumbee and percentage of population with at least 11th grade education in the United States with a correlation coefficient (R) of -0.165 and weighted average of 88.9%. Similarly, the statistical analysis conducted on geographies consisting of 211,528,629 people shows a weak positive correlation between the proportion of Immigrants from Ethiopia and percentage of population with at least 11th grade education in the United States with a correlation coefficient (R) of 0.233 and weighted average of 92.1%, a difference of 3.6%.
11th Grade Correlation Summary
| Measurement | Lumbee | Immigrants from Ethiopia |
| Minimum | 75.4% | 79.0% |
| Maximum | 100.0% | 100.0% |
| Range | 24.6% | 21.0% |
| Mean | 88.4% | 91.4% |
| Median | 89.2% | 92.0% |
| Interquartile 25% (IQ1) | 83.9% | 89.5% |
| Interquartile 75% (IQ3) | 92.1% | 93.5% |
| Interquartile Range (IQR) | 8.2% | 4.0% |
| Standard Deviation (Sample) | 5.8% | 4.1% |
| Standard Deviation (Population) | 5.7% | 4.0% |
Similar Demographics by 11th Grade
Demographics Similar to Lumbee by 11th Grade
In terms of 11th grade, the demographic groups most similar to Lumbee are Immigrants from Cuba (88.9%, a difference of 0.010%), Nicaraguan (88.9%, a difference of 0.060%), Belizean (88.8%, a difference of 0.15%), Immigrants from Ecuador (89.1%, a difference of 0.16%), and Cape Verdean (89.1%, a difference of 0.17%).
| Demographics | Rating | Rank | 11th Grade |
| Yaqui | 0.0 /100 | #310 | Tragic 89.5% |
| Vietnamese | 0.0 /100 | #311 | Tragic 89.4% |
| Immigrants | Portugal | 0.0 /100 | #312 | Tragic 89.3% |
| Immigrants | Caribbean | 0.0 /100 | #313 | Tragic 89.1% |
| Cape Verdeans | 0.0 /100 | #314 | Tragic 89.1% |
| Immigrants | Ecuador | 0.0 /100 | #315 | Tragic 89.1% |
| Immigrants | Cuba | 0.0 /100 | #316 | Tragic 88.9% |
| Lumbee | 0.0 /100 | #317 | Tragic 88.9% |
| Nicaraguans | 0.0 /100 | #318 | Tragic 88.9% |
| Belizeans | 0.0 /100 | #319 | Tragic 88.8% |
| Immigrants | Armenia | 0.0 /100 | #320 | Tragic 88.8% |
| Immigrants | Belize | 0.0 /100 | #321 | Tragic 88.7% |
| Puerto Ricans | 0.0 /100 | #322 | Tragic 88.4% |
| Pima | 0.0 /100 | #323 | Tragic 88.3% |
| Central American Indians | 0.0 /100 | #324 | Tragic 88.2% |
Demographics Similar to Immigrants from Ethiopia by 11th Grade
In terms of 11th grade, the demographic groups most similar to Immigrants from Ethiopia are Korean (92.1%, a difference of 0.010%), Afghan (92.1%, a difference of 0.020%), Immigrants from Southern Europe (92.1%, a difference of 0.030%), Somali (92.1%, a difference of 0.050%), and Immigrants from Sierra Leone (92.0%, a difference of 0.060%).
| Demographics | Rating | Rank | 11th Grade |
| Bolivians | 23.2 /100 | #206 | Fair 92.2% |
| Immigrants | Oceania | 22.4 /100 | #207 | Fair 92.2% |
| Colville | 21.8 /100 | #208 | Fair 92.2% |
| Tongans | 19.8 /100 | #209 | Poor 92.2% |
| Ethiopians | 18.8 /100 | #210 | Poor 92.2% |
| Immigrants | Micronesia | 17.7 /100 | #211 | Poor 92.2% |
| Koreans | 14.4 /100 | #212 | Poor 92.1% |
| Immigrants | Ethiopia | 13.9 /100 | #213 | Poor 92.1% |
| Afghans | 12.8 /100 | #214 | Poor 92.1% |
| Immigrants | Southern Europe | 12.5 /100 | #215 | Poor 92.1% |
| Somalis | 11.6 /100 | #216 | Poor 92.1% |
| Immigrants | Sierra Leone | 11.1 /100 | #217 | Poor 92.0% |
| Blackfeet | 10.1 /100 | #218 | Poor 92.0% |
| Portuguese | 10.0 /100 | #219 | Tragic 92.0% |
| South American Indians | 7.6 /100 | #220 | Tragic 92.0% |