Lumbee vs Mexican No Schooling Completed
COMPARE
Lumbee
Mexican
No Schooling Completed
No Schooling Completed Comparison
Lumbee
Mexicans
1.5%
NO SCHOOLING COMPLETED
100.0/ 100
METRIC RATING
29th/ 347
METRIC RANK
3.3%
NO SCHOOLING COMPLETED
0.0/ 100
METRIC RATING
328th/ 347
METRIC RANK
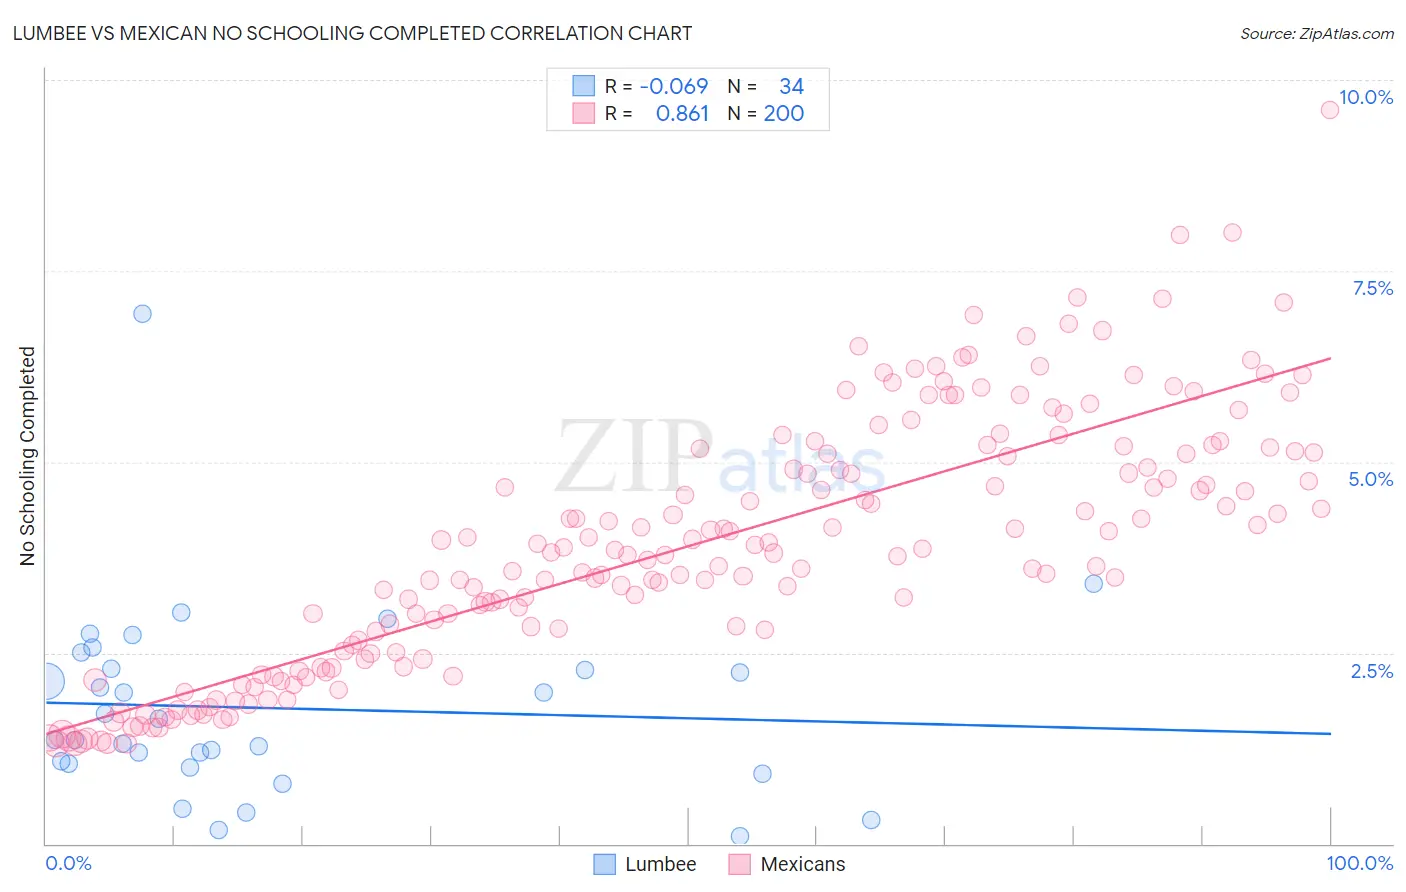
Lumbee vs Mexican No Schooling Completed Correlation Chart
The statistical analysis conducted on geographies consisting of 91,955,229 people shows a slight negative correlation between the proportion of Lumbee and percentage of population with no schooling in the United States with a correlation coefficient (R) of -0.069 and weighted average of 1.5%. Similarly, the statistical analysis conducted on geographies consisting of 549,296,204 people shows a very strong positive correlation between the proportion of Mexicans and percentage of population with no schooling in the United States with a correlation coefficient (R) of 0.861 and weighted average of 3.3%, a difference of 117.7%.
No Schooling Completed Correlation Summary
| Measurement | Lumbee | Mexican |
| Minimum | 0.093% | 1.3% |
| Maximum | 6.9% | 9.6% |
| Range | 6.9% | 8.3% |
| Mean | 1.8% | 3.9% |
| Median | 1.5% | 3.8% |
| Interquartile 25% (IQ1) | 1.0% | 2.5% |
| Interquartile 75% (IQ3) | 2.3% | 5.1% |
| Interquartile Range (IQR) | 1.2% | 2.6% |
| Standard Deviation (Sample) | 1.3% | 1.7% |
| Standard Deviation (Population) | 1.2% | 1.6% |
Similar Demographics by No Schooling Completed
Demographics Similar to Lumbee by No Schooling Completed
In terms of no schooling completed, the demographic groups most similar to Lumbee are British (1.5%, a difference of 0.48%), Inupiat (1.5%, a difference of 0.51%), French Canadian (1.5%, a difference of 0.91%), Swiss (1.5%, a difference of 0.91%), and Scandinavian (1.5%, a difference of 0.92%).
| Demographics | Rating | Rank | No Schooling Completed |
| Alaska Natives | 100.0 /100 | #22 | Exceptional 1.5% |
| Europeans | 100.0 /100 | #23 | Exceptional 1.5% |
| Pennsylvania Germans | 100.0 /100 | #24 | Exceptional 1.5% |
| French | 100.0 /100 | #25 | Exceptional 1.5% |
| Czechs | 100.0 /100 | #26 | Exceptional 1.5% |
| Scandinavians | 100.0 /100 | #27 | Exceptional 1.5% |
| French Canadians | 100.0 /100 | #28 | Exceptional 1.5% |
| Lumbee | 100.0 /100 | #29 | Exceptional 1.5% |
| British | 100.0 /100 | #30 | Exceptional 1.5% |
| Inupiat | 100.0 /100 | #31 | Exceptional 1.5% |
| Swiss | 100.0 /100 | #32 | Exceptional 1.5% |
| Italians | 100.0 /100 | #33 | Exceptional 1.5% |
| Latvians | 100.0 /100 | #34 | Exceptional 1.5% |
| Eastern Europeans | 100.0 /100 | #35 | Exceptional 1.6% |
| Aleuts | 99.9 /100 | #36 | Exceptional 1.6% |
Demographics Similar to Mexicans by No Schooling Completed
In terms of no schooling completed, the demographic groups most similar to Mexicans are Immigrants from Latin America (3.3%, a difference of 0.22%), Immigrants from Vietnam (3.3%, a difference of 1.1%), Immigrants from Armenia (3.3%, a difference of 1.5%), Japanese (3.3%, a difference of 1.5%), and Indonesian (3.2%, a difference of 2.7%).
| Demographics | Rating | Rank | No Schooling Completed |
| Immigrants | Laos | 0.0 /100 | #321 | Tragic 3.1% |
| Immigrants | Honduras | 0.0 /100 | #322 | Tragic 3.2% |
| Vietnamese | 0.0 /100 | #323 | Tragic 3.2% |
| Mexican American Indians | 0.0 /100 | #324 | Tragic 3.2% |
| Dominicans | 0.0 /100 | #325 | Tragic 3.2% |
| Indonesians | 0.0 /100 | #326 | Tragic 3.2% |
| Immigrants | Latin America | 0.0 /100 | #327 | Tragic 3.3% |
| Mexicans | 0.0 /100 | #328 | Tragic 3.3% |
| Immigrants | Vietnam | 0.0 /100 | #329 | Tragic 3.3% |
| Immigrants | Armenia | 0.0 /100 | #330 | Tragic 3.3% |
| Japanese | 0.0 /100 | #331 | Tragic 3.3% |
| Central Americans | 0.0 /100 | #332 | Tragic 3.4% |
| Immigrants | Dominican Republic | 0.0 /100 | #333 | Tragic 3.4% |
| Guatemalans | 0.0 /100 | #334 | Tragic 3.5% |
| Immigrants | Cambodia | 0.0 /100 | #335 | Tragic 3.5% |