Immigrants from Liberia vs Mexican 11th Grade
COMPARE
Immigrants from Liberia
Mexican
11th Grade
11th Grade Comparison
Immigrants from Liberia
Mexicans
91.9%
11TH GRADE
7.0/ 100
METRIC RATING
221st/ 347
METRIC RANK
86.1%
11TH GRADE
0.0/ 100
METRIC RATING
341st/ 347
METRIC RANK
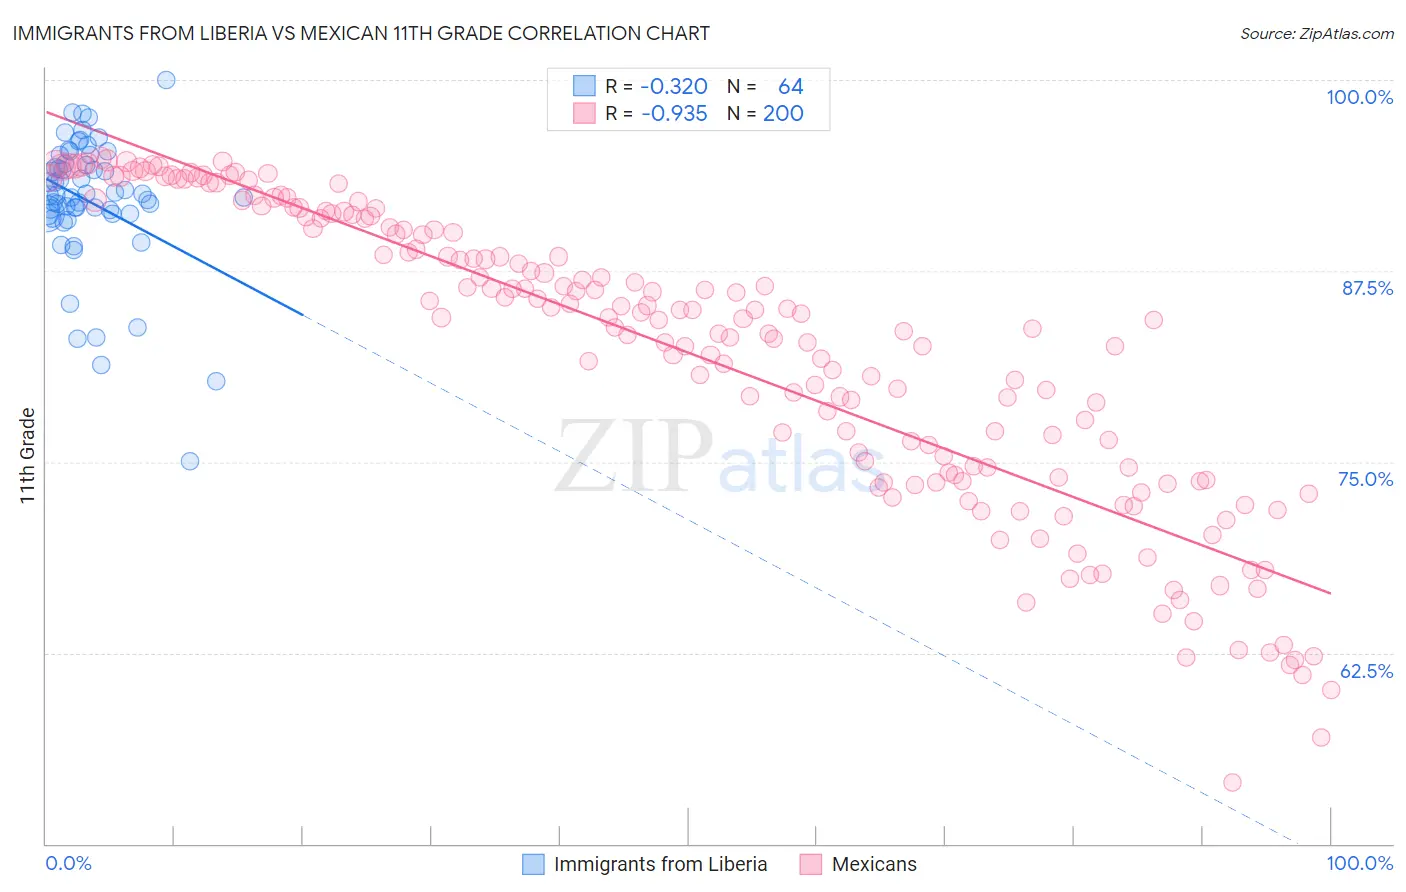
Immigrants from Liberia vs Mexican 11th Grade Correlation Chart
The statistical analysis conducted on geographies consisting of 135,293,967 people shows a mild negative correlation between the proportion of Immigrants from Liberia and percentage of population with at least 11th grade education in the United States with a correlation coefficient (R) of -0.320 and weighted average of 91.9%. Similarly, the statistical analysis conducted on geographies consisting of 565,338,951 people shows a near-perfect negative correlation between the proportion of Mexicans and percentage of population with at least 11th grade education in the United States with a correlation coefficient (R) of -0.935 and weighted average of 86.1%, a difference of 6.8%.
11th Grade Correlation Summary
| Measurement | Immigrants from Liberia | Mexican |
| Minimum | 75.1% | 54.0% |
| Maximum | 100.0% | 94.9% |
| Range | 24.9% | 40.9% |
| Mean | 92.0% | 82.1% |
| Median | 92.4% | 84.4% |
| Interquartile 25% (IQ1) | 91.2% | 74.2% |
| Interquartile 75% (IQ3) | 94.5% | 90.9% |
| Interquartile Range (IQR) | 3.3% | 16.7% |
| Standard Deviation (Sample) | 4.4% | 9.8% |
| Standard Deviation (Population) | 4.4% | 9.7% |
Similar Demographics by 11th Grade
Demographics Similar to Immigrants from Liberia by 11th Grade
In terms of 11th grade, the demographic groups most similar to Immigrants from Liberia are South American Indian (92.0%, a difference of 0.020%), Immigrants from Africa (91.9%, a difference of 0.020%), Immigrants from Bahamas (91.9%, a difference of 0.020%), Costa Rican (91.9%, a difference of 0.030%), and Immigrants from Zaire (91.9%, a difference of 0.070%).
| Demographics | Rating | Rank | 11th Grade |
| Afghans | 12.8 /100 | #214 | Poor 92.1% |
| Immigrants | Southern Europe | 12.5 /100 | #215 | Poor 92.1% |
| Somalis | 11.6 /100 | #216 | Poor 92.1% |
| Immigrants | Sierra Leone | 11.1 /100 | #217 | Poor 92.0% |
| Blackfeet | 10.1 /100 | #218 | Poor 92.0% |
| Portuguese | 10.0 /100 | #219 | Tragic 92.0% |
| South American Indians | 7.6 /100 | #220 | Tragic 92.0% |
| Immigrants | Liberia | 7.0 /100 | #221 | Tragic 91.9% |
| Immigrants | Africa | 6.5 /100 | #222 | Tragic 91.9% |
| Immigrants | Bahamas | 6.5 /100 | #223 | Tragic 91.9% |
| Costa Ricans | 6.3 /100 | #224 | Tragic 91.9% |
| Immigrants | Zaire | 5.4 /100 | #225 | Tragic 91.9% |
| Immigrants | Somalia | 5.2 /100 | #226 | Tragic 91.9% |
| Immigrants | Cameroon | 4.4 /100 | #227 | Tragic 91.8% |
| Immigrants | Panama | 4.3 /100 | #228 | Tragic 91.8% |
Demographics Similar to Mexicans by 11th Grade
In terms of 11th grade, the demographic groups most similar to Mexicans are Salvadoran (86.2%, a difference of 0.060%), Guatemalan (86.4%, a difference of 0.29%), Immigrants from Guatemala (85.8%, a difference of 0.33%), Immigrants from Latin America (86.8%, a difference of 0.78%), and Immigrants from Dominican Republic (86.9%, a difference of 0.91%).
| Demographics | Rating | Rank | 11th Grade |
| Immigrants | Yemen | 0.0 /100 | #333 | Tragic 87.1% |
| Houma | 0.0 /100 | #334 | Tragic 87.0% |
| Central Americans | 0.0 /100 | #335 | Tragic 86.9% |
| Immigrants | Dominican Republic | 0.0 /100 | #336 | Tragic 86.9% |
| Immigrants | Honduras | 0.0 /100 | #337 | Tragic 86.9% |
| Immigrants | Latin America | 0.0 /100 | #338 | Tragic 86.8% |
| Guatemalans | 0.0 /100 | #339 | Tragic 86.4% |
| Salvadorans | 0.0 /100 | #340 | Tragic 86.2% |
| Mexicans | 0.0 /100 | #341 | Tragic 86.1% |
| Immigrants | Guatemala | 0.0 /100 | #342 | Tragic 85.8% |
| Immigrants | El Salvador | 0.0 /100 | #343 | Tragic 85.3% |
| Yakama | 0.0 /100 | #344 | Tragic 85.0% |
| Immigrants | Central America | 0.0 /100 | #345 | Tragic 84.9% |
| Spanish American Indians | 0.0 /100 | #346 | Tragic 84.7% |
| Immigrants | Mexico | 0.0 /100 | #347 | Tragic 84.5% |