Immigrants from Iraq vs Mexican 11th Grade
COMPARE
Immigrants from Iraq
Mexican
11th Grade
11th Grade Comparison
Immigrants from Iraq
Mexicans
92.6%
11TH GRADE
63.7/ 100
METRIC RATING
165th/ 347
METRIC RANK
86.1%
11TH GRADE
0.0/ 100
METRIC RATING
341st/ 347
METRIC RANK
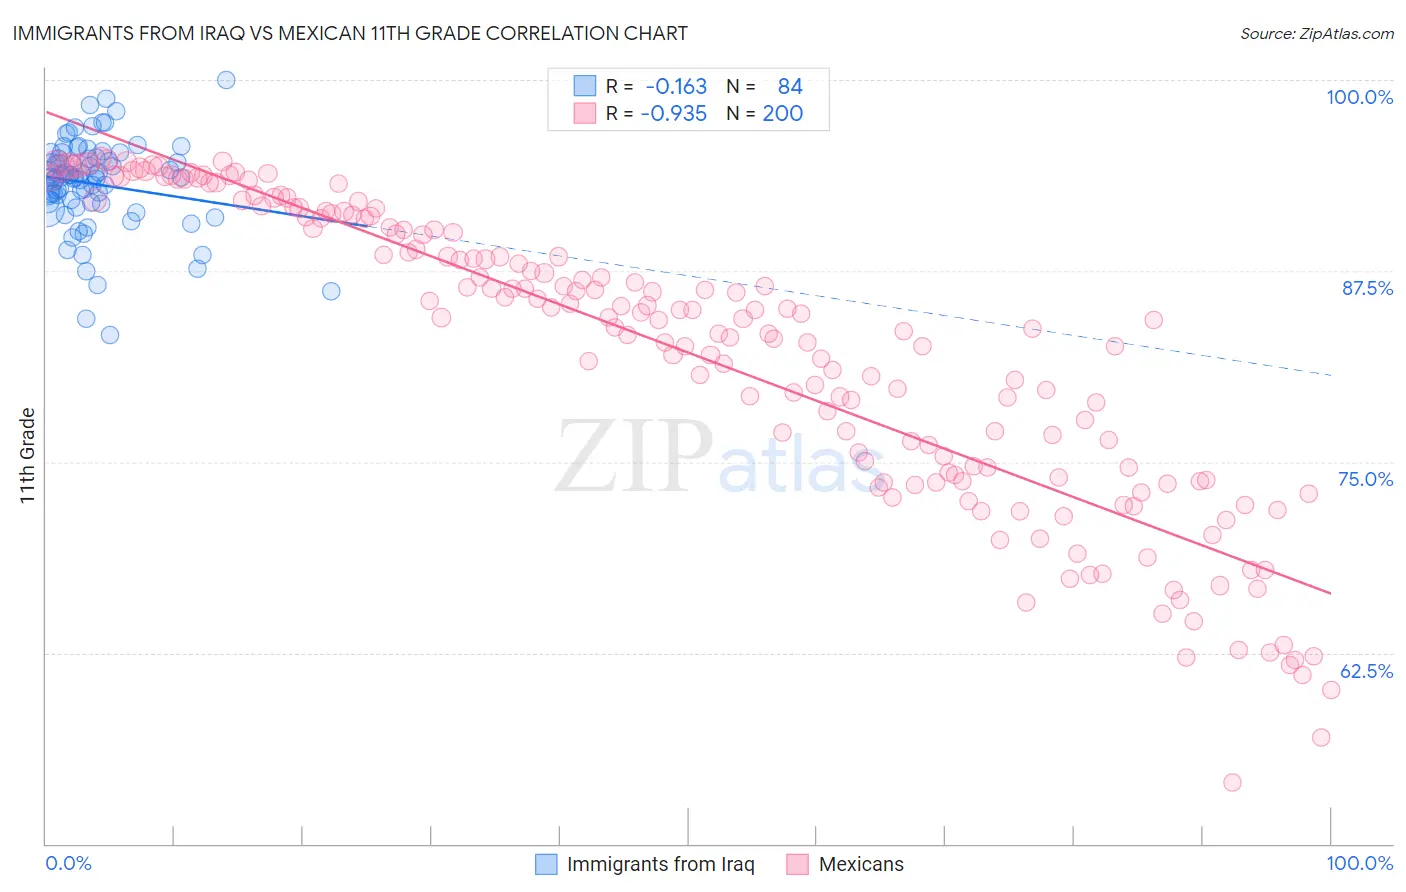
Immigrants from Iraq vs Mexican 11th Grade Correlation Chart
The statistical analysis conducted on geographies consisting of 194,685,376 people shows a poor negative correlation between the proportion of Immigrants from Iraq and percentage of population with at least 11th grade education in the United States with a correlation coefficient (R) of -0.163 and weighted average of 92.6%. Similarly, the statistical analysis conducted on geographies consisting of 565,338,951 people shows a near-perfect negative correlation between the proportion of Mexicans and percentage of population with at least 11th grade education in the United States with a correlation coefficient (R) of -0.935 and weighted average of 86.1%, a difference of 7.6%.
11th Grade Correlation Summary
| Measurement | Immigrants from Iraq | Mexican |
| Minimum | 83.3% | 54.0% |
| Maximum | 100.0% | 94.9% |
| Range | 16.7% | 40.9% |
| Mean | 93.2% | 82.1% |
| Median | 93.6% | 84.4% |
| Interquartile 25% (IQ1) | 91.9% | 74.2% |
| Interquartile 75% (IQ3) | 94.9% | 90.9% |
| Interquartile Range (IQR) | 3.0% | 16.7% |
| Standard Deviation (Sample) | 3.0% | 9.8% |
| Standard Deviation (Population) | 3.0% | 9.7% |
Similar Demographics by 11th Grade
Demographics Similar to Immigrants from Iraq by 11th Grade
In terms of 11th grade, the demographic groups most similar to Immigrants from Iraq are Bermudan (92.6%, a difference of 0.010%), Nonimmigrants (92.7%, a difference of 0.030%), Spanish (92.7%, a difference of 0.030%), Alsatian (92.6%, a difference of 0.040%), and Paraguayan (92.7%, a difference of 0.050%).
| Demographics | Rating | Rank | 11th Grade |
| Immigrants | Venezuela | 72.0 /100 | #158 | Good 92.7% |
| Americans | 71.7 /100 | #159 | Good 92.7% |
| Immigrants | Lebanon | 70.7 /100 | #160 | Good 92.7% |
| Immigrants | Argentina | 69.8 /100 | #161 | Good 92.7% |
| Paraguayans | 68.7 /100 | #162 | Good 92.7% |
| Immigrants | Nonimmigrants | 66.6 /100 | #163 | Good 92.7% |
| Spanish | 66.2 /100 | #164 | Good 92.7% |
| Immigrants | Iraq | 63.7 /100 | #165 | Good 92.6% |
| Bermudans | 62.3 /100 | #166 | Good 92.6% |
| Alsatians | 60.2 /100 | #167 | Good 92.6% |
| Sierra Leoneans | 58.7 /100 | #168 | Average 92.6% |
| Immigrants | Albania | 57.8 /100 | #169 | Average 92.6% |
| Immigrants | Northern Africa | 57.3 /100 | #170 | Average 92.6% |
| Laotians | 54.4 /100 | #171 | Average 92.6% |
| Immigrants | Pakistan | 52.3 /100 | #172 | Average 92.5% |
Demographics Similar to Mexicans by 11th Grade
In terms of 11th grade, the demographic groups most similar to Mexicans are Salvadoran (86.2%, a difference of 0.060%), Guatemalan (86.4%, a difference of 0.29%), Immigrants from Guatemala (85.8%, a difference of 0.33%), Immigrants from Latin America (86.8%, a difference of 0.78%), and Immigrants from Dominican Republic (86.9%, a difference of 0.91%).
| Demographics | Rating | Rank | 11th Grade |
| Immigrants | Yemen | 0.0 /100 | #333 | Tragic 87.1% |
| Houma | 0.0 /100 | #334 | Tragic 87.0% |
| Central Americans | 0.0 /100 | #335 | Tragic 86.9% |
| Immigrants | Dominican Republic | 0.0 /100 | #336 | Tragic 86.9% |
| Immigrants | Honduras | 0.0 /100 | #337 | Tragic 86.9% |
| Immigrants | Latin America | 0.0 /100 | #338 | Tragic 86.8% |
| Guatemalans | 0.0 /100 | #339 | Tragic 86.4% |
| Salvadorans | 0.0 /100 | #340 | Tragic 86.2% |
| Mexicans | 0.0 /100 | #341 | Tragic 86.1% |
| Immigrants | Guatemala | 0.0 /100 | #342 | Tragic 85.8% |
| Immigrants | El Salvador | 0.0 /100 | #343 | Tragic 85.3% |
| Yakama | 0.0 /100 | #344 | Tragic 85.0% |
| Immigrants | Central America | 0.0 /100 | #345 | Tragic 84.9% |
| Spanish American Indians | 0.0 /100 | #346 | Tragic 84.7% |
| Immigrants | Mexico | 0.0 /100 | #347 | Tragic 84.5% |