Lumbee vs Sierra Leonean 11th Grade
COMPARE
Lumbee
Sierra Leonean
11th Grade
11th Grade Comparison
Lumbee
Sierra Leoneans
88.9%
11TH GRADE
0.0/ 100
METRIC RATING
317th/ 347
METRIC RANK
92.6%
11TH GRADE
58.7/ 100
METRIC RATING
168th/ 347
METRIC RANK
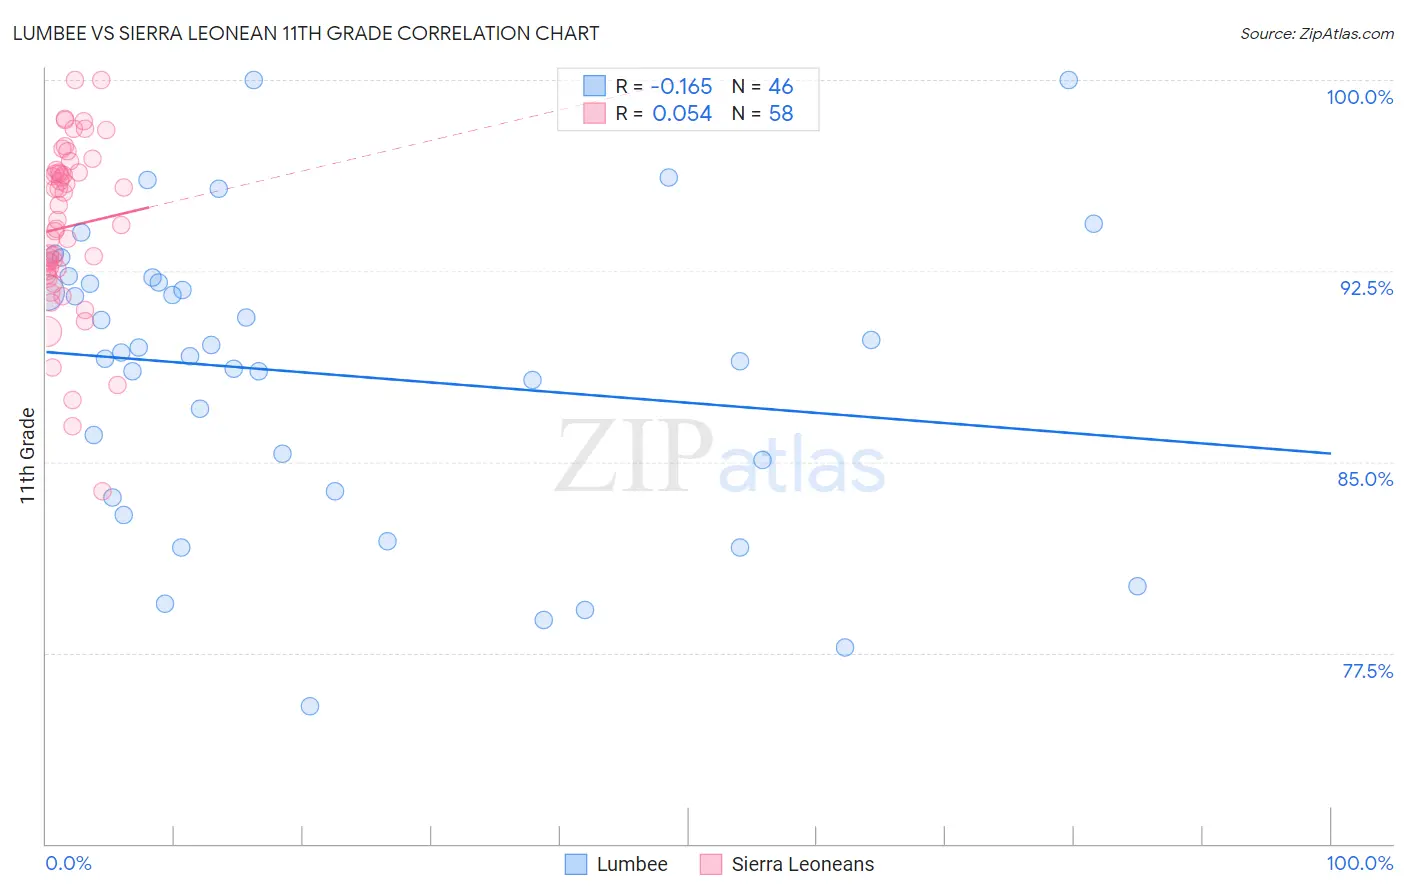
Lumbee vs Sierra Leonean 11th Grade Correlation Chart
The statistical analysis conducted on geographies consisting of 92,299,068 people shows a poor negative correlation between the proportion of Lumbee and percentage of population with at least 11th grade education in the United States with a correlation coefficient (R) of -0.165 and weighted average of 88.9%. Similarly, the statistical analysis conducted on geographies consisting of 83,355,497 people shows a slight positive correlation between the proportion of Sierra Leoneans and percentage of population with at least 11th grade education in the United States with a correlation coefficient (R) of 0.054 and weighted average of 92.6%, a difference of 4.1%.
11th Grade Correlation Summary
| Measurement | Lumbee | Sierra Leonean |
| Minimum | 75.4% | 83.9% |
| Maximum | 100.0% | 100.0% |
| Range | 24.6% | 16.1% |
| Mean | 88.4% | 94.2% |
| Median | 89.2% | 94.4% |
| Interquartile 25% (IQ1) | 83.9% | 92.5% |
| Interquartile 75% (IQ3) | 92.1% | 96.4% |
| Interquartile Range (IQR) | 8.2% | 3.9% |
| Standard Deviation (Sample) | 5.8% | 3.3% |
| Standard Deviation (Population) | 5.7% | 3.3% |
Similar Demographics by 11th Grade
Demographics Similar to Lumbee by 11th Grade
In terms of 11th grade, the demographic groups most similar to Lumbee are Immigrants from Cuba (88.9%, a difference of 0.010%), Nicaraguan (88.9%, a difference of 0.060%), Belizean (88.8%, a difference of 0.15%), Immigrants from Ecuador (89.1%, a difference of 0.16%), and Cape Verdean (89.1%, a difference of 0.17%).
| Demographics | Rating | Rank | 11th Grade |
| Yaqui | 0.0 /100 | #310 | Tragic 89.5% |
| Vietnamese | 0.0 /100 | #311 | Tragic 89.4% |
| Immigrants | Portugal | 0.0 /100 | #312 | Tragic 89.3% |
| Immigrants | Caribbean | 0.0 /100 | #313 | Tragic 89.1% |
| Cape Verdeans | 0.0 /100 | #314 | Tragic 89.1% |
| Immigrants | Ecuador | 0.0 /100 | #315 | Tragic 89.1% |
| Immigrants | Cuba | 0.0 /100 | #316 | Tragic 88.9% |
| Lumbee | 0.0 /100 | #317 | Tragic 88.9% |
| Nicaraguans | 0.0 /100 | #318 | Tragic 88.9% |
| Belizeans | 0.0 /100 | #319 | Tragic 88.8% |
| Immigrants | Armenia | 0.0 /100 | #320 | Tragic 88.8% |
| Immigrants | Belize | 0.0 /100 | #321 | Tragic 88.7% |
| Puerto Ricans | 0.0 /100 | #322 | Tragic 88.4% |
| Pima | 0.0 /100 | #323 | Tragic 88.3% |
| Central American Indians | 0.0 /100 | #324 | Tragic 88.2% |
Demographics Similar to Sierra Leoneans by 11th Grade
In terms of 11th grade, the demographic groups most similar to Sierra Leoneans are Immigrants from Albania (92.6%, a difference of 0.010%), Immigrants from Northern Africa (92.6%, a difference of 0.010%), Alsatian (92.6%, a difference of 0.020%), Bermudan (92.6%, a difference of 0.040%), and Laotian (92.6%, a difference of 0.040%).
| Demographics | Rating | Rank | 11th Grade |
| Immigrants | Argentina | 69.8 /100 | #161 | Good 92.7% |
| Paraguayans | 68.7 /100 | #162 | Good 92.7% |
| Immigrants | Nonimmigrants | 66.6 /100 | #163 | Good 92.7% |
| Spanish | 66.2 /100 | #164 | Good 92.7% |
| Immigrants | Iraq | 63.7 /100 | #165 | Good 92.6% |
| Bermudans | 62.3 /100 | #166 | Good 92.6% |
| Alsatians | 60.2 /100 | #167 | Good 92.6% |
| Sierra Leoneans | 58.7 /100 | #168 | Average 92.6% |
| Immigrants | Albania | 57.8 /100 | #169 | Average 92.6% |
| Immigrants | Northern Africa | 57.3 /100 | #170 | Average 92.6% |
| Laotians | 54.4 /100 | #171 | Average 92.6% |
| Immigrants | Pakistan | 52.3 /100 | #172 | Average 92.5% |
| Indians (Asian) | 51.5 /100 | #173 | Average 92.5% |
| Asians | 50.0 /100 | #174 | Average 92.5% |
| Shoshone | 48.9 /100 | #175 | Average 92.5% |