Liberian vs Immigrants from Vietnam 11th Grade
COMPARE
Liberian
Immigrants from Vietnam
11th Grade
11th Grade Comparison
Liberians
Immigrants from Vietnam
92.3%
11TH GRADE
26.8/ 100
METRIC RATING
195th/ 347
METRIC RANK
90.0%
11TH GRADE
0.0/ 100
METRIC RATING
295th/ 347
METRIC RANK
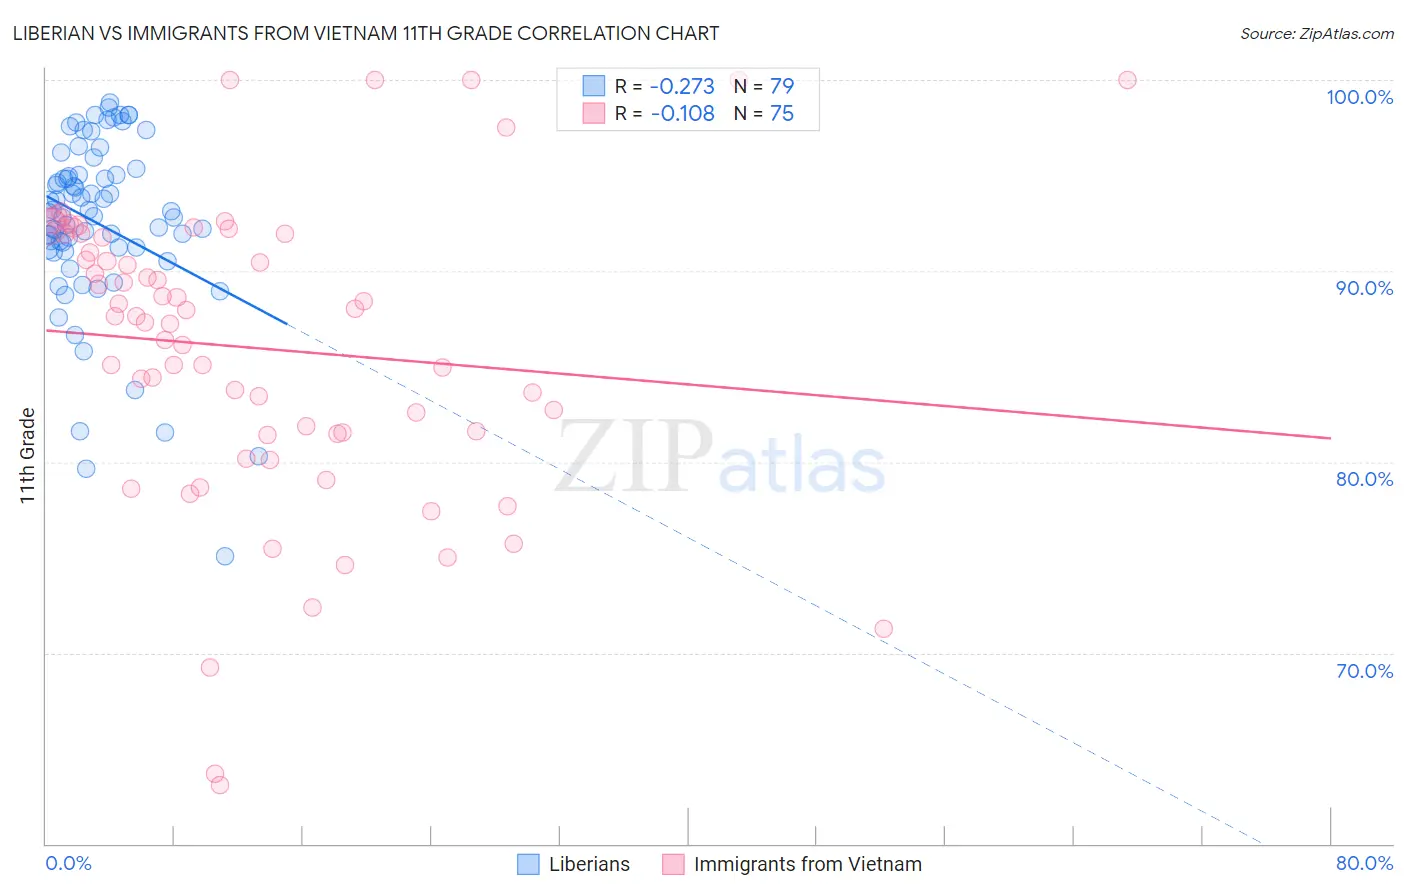
Liberian vs Immigrants from Vietnam 11th Grade Correlation Chart
The statistical analysis conducted on geographies consisting of 118,101,728 people shows a weak negative correlation between the proportion of Liberians and percentage of population with at least 11th grade education in the United States with a correlation coefficient (R) of -0.273 and weighted average of 92.3%. Similarly, the statistical analysis conducted on geographies consisting of 404,843,921 people shows a poor negative correlation between the proportion of Immigrants from Vietnam and percentage of population with at least 11th grade education in the United States with a correlation coefficient (R) of -0.108 and weighted average of 90.0%, a difference of 2.5%.
11th Grade Correlation Summary
| Measurement | Liberian | Immigrants from Vietnam |
| Minimum | 75.1% | 63.1% |
| Maximum | 98.8% | 100.0% |
| Range | 23.7% | 36.9% |
| Mean | 92.5% | 85.9% |
| Median | 93.1% | 87.6% |
| Interquartile 25% (IQ1) | 91.2% | 81.5% |
| Interquartile 75% (IQ3) | 95.1% | 91.9% |
| Interquartile Range (IQR) | 3.8% | 10.4% |
| Standard Deviation (Sample) | 4.6% | 7.9% |
| Standard Deviation (Population) | 4.6% | 7.9% |
Similar Demographics by 11th Grade
Demographics Similar to Liberians by 11th Grade
In terms of 11th grade, the demographic groups most similar to Liberians are Panamanian (92.3%, a difference of 0.010%), Marshallese (92.3%, a difference of 0.010%), Moroccan (92.3%, a difference of 0.020%), Sioux (92.3%, a difference of 0.020%), and Hawaiian (92.3%, a difference of 0.020%).
| Demographics | Rating | Rank | 11th Grade |
| Immigrants | Indonesia | 33.7 /100 | #188 | Fair 92.4% |
| Immigrants | Chile | 33.3 /100 | #189 | Fair 92.4% |
| Chickasaw | 31.4 /100 | #190 | Fair 92.3% |
| French American Indians | 30.8 /100 | #191 | Fair 92.3% |
| Immigrants | Syria | 30.4 /100 | #192 | Fair 92.3% |
| Moroccans | 28.7 /100 | #193 | Fair 92.3% |
| Sioux | 28.5 /100 | #194 | Fair 92.3% |
| Liberians | 26.8 /100 | #195 | Fair 92.3% |
| Panamanians | 26.4 /100 | #196 | Fair 92.3% |
| Marshallese | 26.0 /100 | #197 | Fair 92.3% |
| Hawaiians | 25.5 /100 | #198 | Fair 92.3% |
| Immigrants | Uganda | 25.2 /100 | #199 | Fair 92.3% |
| Samoans | 25.1 /100 | #200 | Fair 92.3% |
| Immigrants | China | 25.1 /100 | #201 | Fair 92.3% |
| Immigrants | Eastern Africa | 24.1 /100 | #202 | Fair 92.3% |
Demographics Similar to Immigrants from Vietnam by 11th Grade
In terms of 11th grade, the demographic groups most similar to Immigrants from Vietnam are Fijian (90.0%, a difference of 0.020%), Navajo (90.0%, a difference of 0.060%), Immigrants from Grenada (90.1%, a difference of 0.11%), Immigrants from Fiji (89.9%, a difference of 0.13%), and Native/Alaskan (90.2%, a difference of 0.15%).
| Demographics | Rating | Rank | 11th Grade |
| Pennsylvania Germans | 0.0 /100 | #288 | Tragic 90.3% |
| British West Indians | 0.0 /100 | #289 | Tragic 90.3% |
| Indonesians | 0.0 /100 | #290 | Tragic 90.3% |
| Haitians | 0.0 /100 | #291 | Tragic 90.3% |
| Cubans | 0.0 /100 | #292 | Tragic 90.2% |
| Natives/Alaskans | 0.0 /100 | #293 | Tragic 90.2% |
| Immigrants | Grenada | 0.0 /100 | #294 | Tragic 90.1% |
| Immigrants | Vietnam | 0.0 /100 | #295 | Tragic 90.0% |
| Fijians | 0.0 /100 | #296 | Tragic 90.0% |
| Navajo | 0.0 /100 | #297 | Tragic 90.0% |
| Immigrants | Fiji | 0.0 /100 | #298 | Tragic 89.9% |
| Japanese | 0.0 /100 | #299 | Tragic 89.9% |
| Immigrants | Haiti | 0.0 /100 | #300 | Tragic 89.9% |
| Guyanese | 0.0 /100 | #301 | Tragic 89.9% |
| Immigrants | Guyana | 0.0 /100 | #302 | Tragic 89.7% |