Immigrants from Somalia vs Immigrants from Vietnam 11th Grade
COMPARE
Immigrants from Somalia
Immigrants from Vietnam
11th Grade
11th Grade Comparison
Immigrants from Somalia
Immigrants from Vietnam
91.9%
11TH GRADE
5.2/ 100
METRIC RATING
226th/ 347
METRIC RANK
90.0%
11TH GRADE
0.0/ 100
METRIC RATING
295th/ 347
METRIC RANK
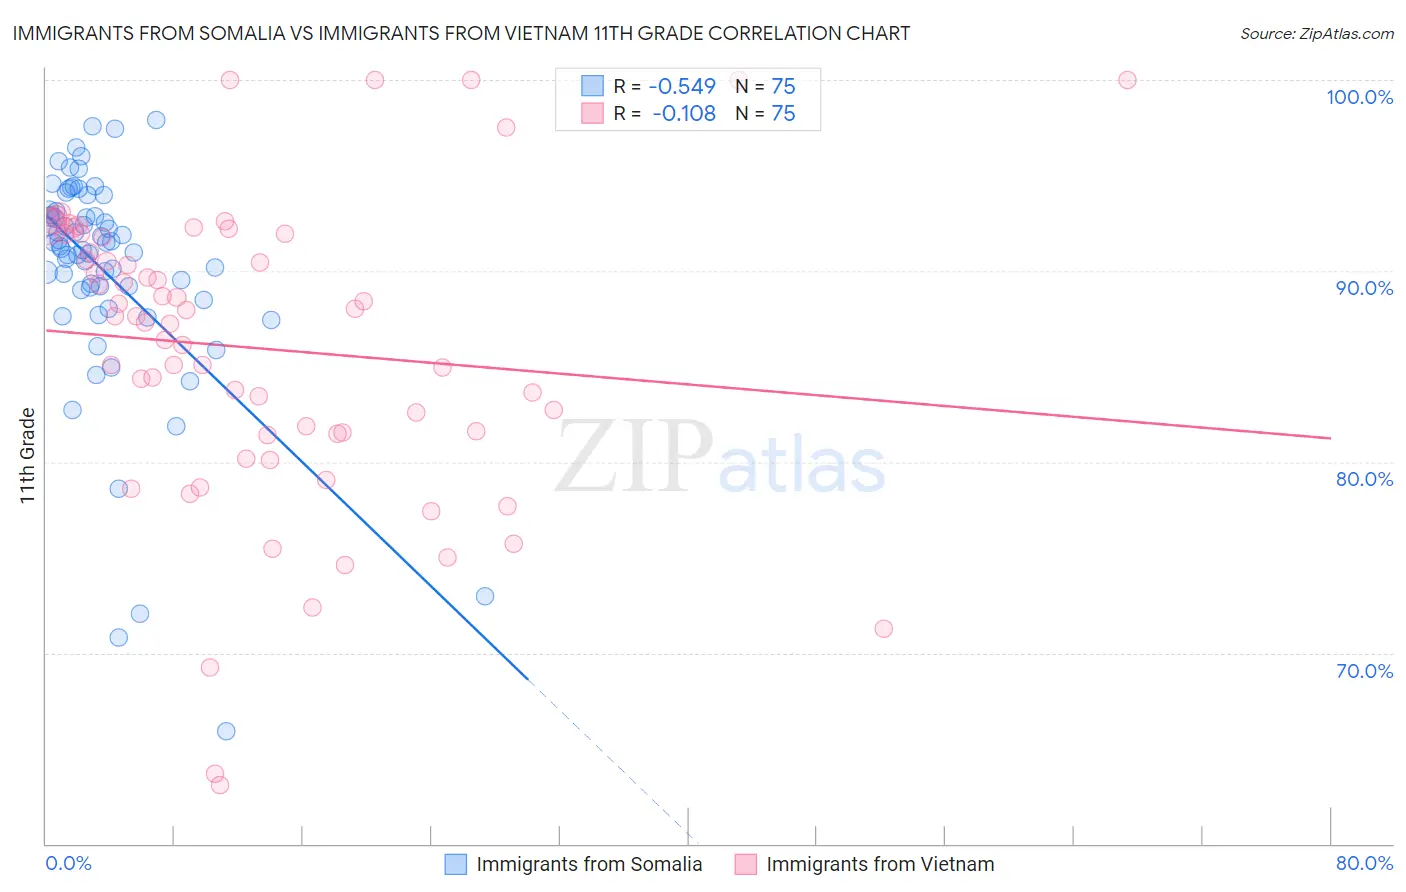
Immigrants from Somalia vs Immigrants from Vietnam 11th Grade Correlation Chart
The statistical analysis conducted on geographies consisting of 92,101,093 people shows a substantial negative correlation between the proportion of Immigrants from Somalia and percentage of population with at least 11th grade education in the United States with a correlation coefficient (R) of -0.549 and weighted average of 91.9%. Similarly, the statistical analysis conducted on geographies consisting of 404,843,921 people shows a poor negative correlation between the proportion of Immigrants from Vietnam and percentage of population with at least 11th grade education in the United States with a correlation coefficient (R) of -0.108 and weighted average of 90.0%, a difference of 2.0%.
11th Grade Correlation Summary
| Measurement | Immigrants from Somalia | Immigrants from Vietnam |
| Minimum | 65.9% | 63.1% |
| Maximum | 97.9% | 100.0% |
| Range | 32.0% | 36.9% |
| Mean | 90.0% | 85.9% |
| Median | 91.3% | 87.6% |
| Interquartile 25% (IQ1) | 89.0% | 81.5% |
| Interquartile 75% (IQ3) | 93.1% | 91.9% |
| Interquartile Range (IQR) | 4.1% | 10.4% |
| Standard Deviation (Sample) | 5.9% | 7.9% |
| Standard Deviation (Population) | 5.9% | 7.9% |
Similar Demographics by 11th Grade
Demographics Similar to Immigrants from Somalia by 11th Grade
In terms of 11th grade, the demographic groups most similar to Immigrants from Somalia are Immigrants from Zaire (91.9%, a difference of 0.010%), Costa Rican (91.9%, a difference of 0.050%), Immigrants from Cameroon (91.8%, a difference of 0.050%), Immigrants from Panama (91.8%, a difference of 0.050%), and Nigerian (91.8%, a difference of 0.050%).
| Demographics | Rating | Rank | 11th Grade |
| Portuguese | 10.0 /100 | #219 | Tragic 92.0% |
| South American Indians | 7.6 /100 | #220 | Tragic 92.0% |
| Immigrants | Liberia | 7.0 /100 | #221 | Tragic 91.9% |
| Immigrants | Africa | 6.5 /100 | #222 | Tragic 91.9% |
| Immigrants | Bahamas | 6.5 /100 | #223 | Tragic 91.9% |
| Costa Ricans | 6.3 /100 | #224 | Tragic 91.9% |
| Immigrants | Zaire | 5.4 /100 | #225 | Tragic 91.9% |
| Immigrants | Somalia | 5.2 /100 | #226 | Tragic 91.9% |
| Immigrants | Cameroon | 4.4 /100 | #227 | Tragic 91.8% |
| Immigrants | Panama | 4.3 /100 | #228 | Tragic 91.8% |
| Nigerians | 4.3 /100 | #229 | Tragic 91.8% |
| Immigrants | Afghanistan | 3.9 /100 | #230 | Tragic 91.8% |
| Choctaw | 3.7 /100 | #231 | Tragic 91.8% |
| Uruguayans | 3.5 /100 | #232 | Tragic 91.8% |
| Cheyenne | 3.3 /100 | #233 | Tragic 91.8% |
Demographics Similar to Immigrants from Vietnam by 11th Grade
In terms of 11th grade, the demographic groups most similar to Immigrants from Vietnam are Fijian (90.0%, a difference of 0.020%), Navajo (90.0%, a difference of 0.060%), Immigrants from Grenada (90.1%, a difference of 0.11%), Immigrants from Fiji (89.9%, a difference of 0.13%), and Native/Alaskan (90.2%, a difference of 0.15%).
| Demographics | Rating | Rank | 11th Grade |
| Pennsylvania Germans | 0.0 /100 | #288 | Tragic 90.3% |
| British West Indians | 0.0 /100 | #289 | Tragic 90.3% |
| Indonesians | 0.0 /100 | #290 | Tragic 90.3% |
| Haitians | 0.0 /100 | #291 | Tragic 90.3% |
| Cubans | 0.0 /100 | #292 | Tragic 90.2% |
| Natives/Alaskans | 0.0 /100 | #293 | Tragic 90.2% |
| Immigrants | Grenada | 0.0 /100 | #294 | Tragic 90.1% |
| Immigrants | Vietnam | 0.0 /100 | #295 | Tragic 90.0% |
| Fijians | 0.0 /100 | #296 | Tragic 90.0% |
| Navajo | 0.0 /100 | #297 | Tragic 90.0% |
| Immigrants | Fiji | 0.0 /100 | #298 | Tragic 89.9% |
| Japanese | 0.0 /100 | #299 | Tragic 89.9% |
| Immigrants | Haiti | 0.0 /100 | #300 | Tragic 89.9% |
| Guyanese | 0.0 /100 | #301 | Tragic 89.9% |
| Immigrants | Guyana | 0.0 /100 | #302 | Tragic 89.7% |