Lumbee vs Immigrants from Uganda Kindergarten
COMPARE
Lumbee
Immigrants from Uganda
Kindergarten
Kindergarten Comparison
Lumbee
Immigrants from Uganda
98.5%
KINDERGARTEN
99.9/ 100
METRIC RATING
43rd/ 347
METRIC RANK
97.8%
KINDERGARTEN
18.8/ 100
METRIC RATING
203rd/ 347
METRIC RANK
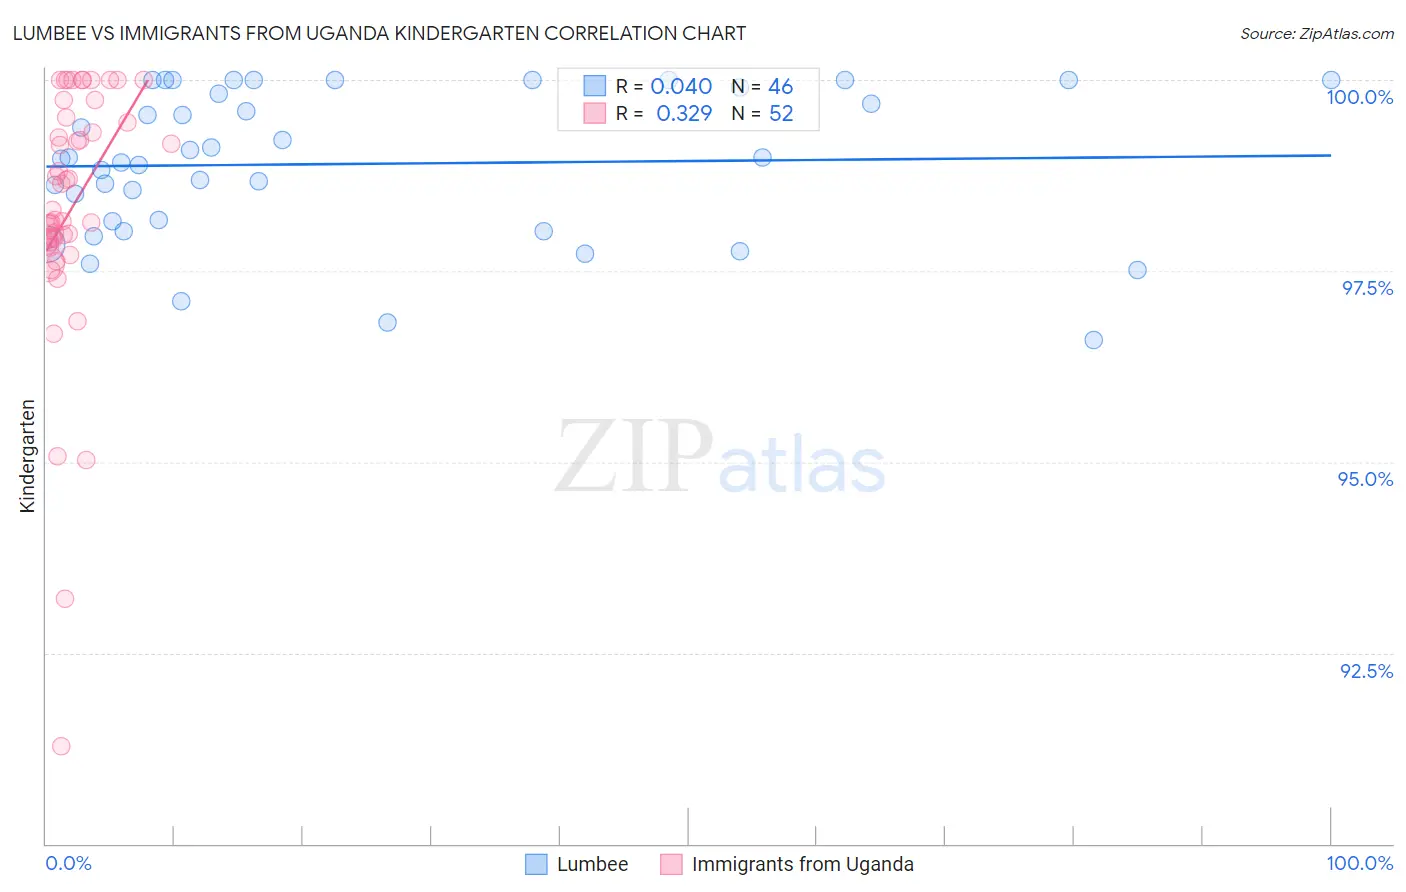
Lumbee vs Immigrants from Uganda Kindergarten Correlation Chart
The statistical analysis conducted on geographies consisting of 92,298,794 people shows no correlation between the proportion of Lumbee and percentage of population with at least kindergarten education in the United States with a correlation coefficient (R) of 0.040 and weighted average of 98.5%. Similarly, the statistical analysis conducted on geographies consisting of 125,941,298 people shows a mild positive correlation between the proportion of Immigrants from Uganda and percentage of population with at least kindergarten education in the United States with a correlation coefficient (R) of 0.329 and weighted average of 97.8%, a difference of 0.65%.
Kindergarten Correlation Summary
| Measurement | Lumbee | Immigrants from Uganda |
| Minimum | 96.6% | 91.3% |
| Maximum | 100.0% | 100.0% |
| Range | 3.4% | 8.7% |
| Mean | 98.9% | 98.3% |
| Median | 99.0% | 98.2% |
| Interquartile 25% (IQ1) | 98.1% | 97.9% |
| Interquartile 75% (IQ3) | 99.9% | 99.5% |
| Interquartile Range (IQR) | 1.8% | 1.6% |
| Standard Deviation (Sample) | 0.96% | 1.7% |
| Standard Deviation (Population) | 0.95% | 1.7% |
Similar Demographics by Kindergarten
Demographics Similar to Lumbee by Kindergarten
In terms of kindergarten, the demographic groups most similar to Lumbee are Northern European (98.5%, a difference of 0.0%), Belgian (98.5%, a difference of 0.0%), Luxembourger (98.5%, a difference of 0.010%), Eastern European (98.5%, a difference of 0.010%), and Native Hawaiian (98.5%, a difference of 0.010%).
| Demographics | Rating | Rank | Kindergarten |
| British | 99.9 /100 | #36 | Exceptional 98.5% |
| Italians | 99.9 /100 | #37 | Exceptional 98.5% |
| Latvians | 99.9 /100 | #38 | Exceptional 98.5% |
| Chippewa | 99.9 /100 | #39 | Exceptional 98.5% |
| Luxembourgers | 99.9 /100 | #40 | Exceptional 98.5% |
| Eastern Europeans | 99.9 /100 | #41 | Exceptional 98.5% |
| Native Hawaiians | 99.9 /100 | #42 | Exceptional 98.5% |
| Lumbee | 99.9 /100 | #43 | Exceptional 98.5% |
| Northern Europeans | 99.9 /100 | #44 | Exceptional 98.5% |
| Belgians | 99.9 /100 | #45 | Exceptional 98.5% |
| Hungarians | 99.9 /100 | #46 | Exceptional 98.5% |
| Czechoslovakians | 99.8 /100 | #47 | Exceptional 98.4% |
| Ottawa | 99.8 /100 | #48 | Exceptional 98.4% |
| Kiowa | 99.8 /100 | #49 | Exceptional 98.4% |
| Whites/Caucasians | 99.8 /100 | #50 | Exceptional 98.4% |
Demographics Similar to Immigrants from Uganda by Kindergarten
In terms of kindergarten, the demographic groups most similar to Immigrants from Uganda are Immigrants from Ukraine (97.8%, a difference of 0.0%), Immigrants from Chile (97.8%, a difference of 0.0%), Immigrants from Southern Europe (97.8%, a difference of 0.0%), Yuman (97.9%, a difference of 0.010%), and Immigrants from Lebanon (97.9%, a difference of 0.010%).
| Demographics | Rating | Rank | Kindergarten |
| Guamanians/Chamorros | 26.2 /100 | #196 | Fair 97.9% |
| Immigrants | Kenya | 25.5 /100 | #197 | Fair 97.9% |
| Tohono O'odham | 24.6 /100 | #198 | Fair 97.9% |
| Immigrants | Egypt | 22.3 /100 | #199 | Fair 97.9% |
| Yuman | 21.6 /100 | #200 | Fair 97.9% |
| Immigrants | Lebanon | 20.9 /100 | #201 | Fair 97.9% |
| Immigrants | Ukraine | 19.1 /100 | #202 | Poor 97.8% |
| Immigrants | Uganda | 18.8 /100 | #203 | Poor 97.8% |
| Immigrants | Chile | 18.1 /100 | #204 | Poor 97.8% |
| Immigrants | Southern Europe | 18.0 /100 | #205 | Poor 97.8% |
| Immigrants | Albania | 16.4 /100 | #206 | Poor 97.8% |
| Africans | 16.1 /100 | #207 | Poor 97.8% |
| Immigrants | Northern Africa | 12.0 /100 | #208 | Poor 97.8% |
| Costa Ricans | 11.6 /100 | #209 | Poor 97.8% |
| Immigrants | Oceania | 11.1 /100 | #210 | Poor 97.8% |