Lumbee vs Russian No Schooling Completed
COMPARE
Lumbee
Russian
No Schooling Completed
No Schooling Completed Comparison
Lumbee
Russians
1.5%
NO SCHOOLING COMPLETED
100.0/ 100
METRIC RATING
29th/ 347
METRIC RANK
1.7%
NO SCHOOLING COMPLETED
99.8/ 100
METRIC RATING
63rd/ 347
METRIC RANK
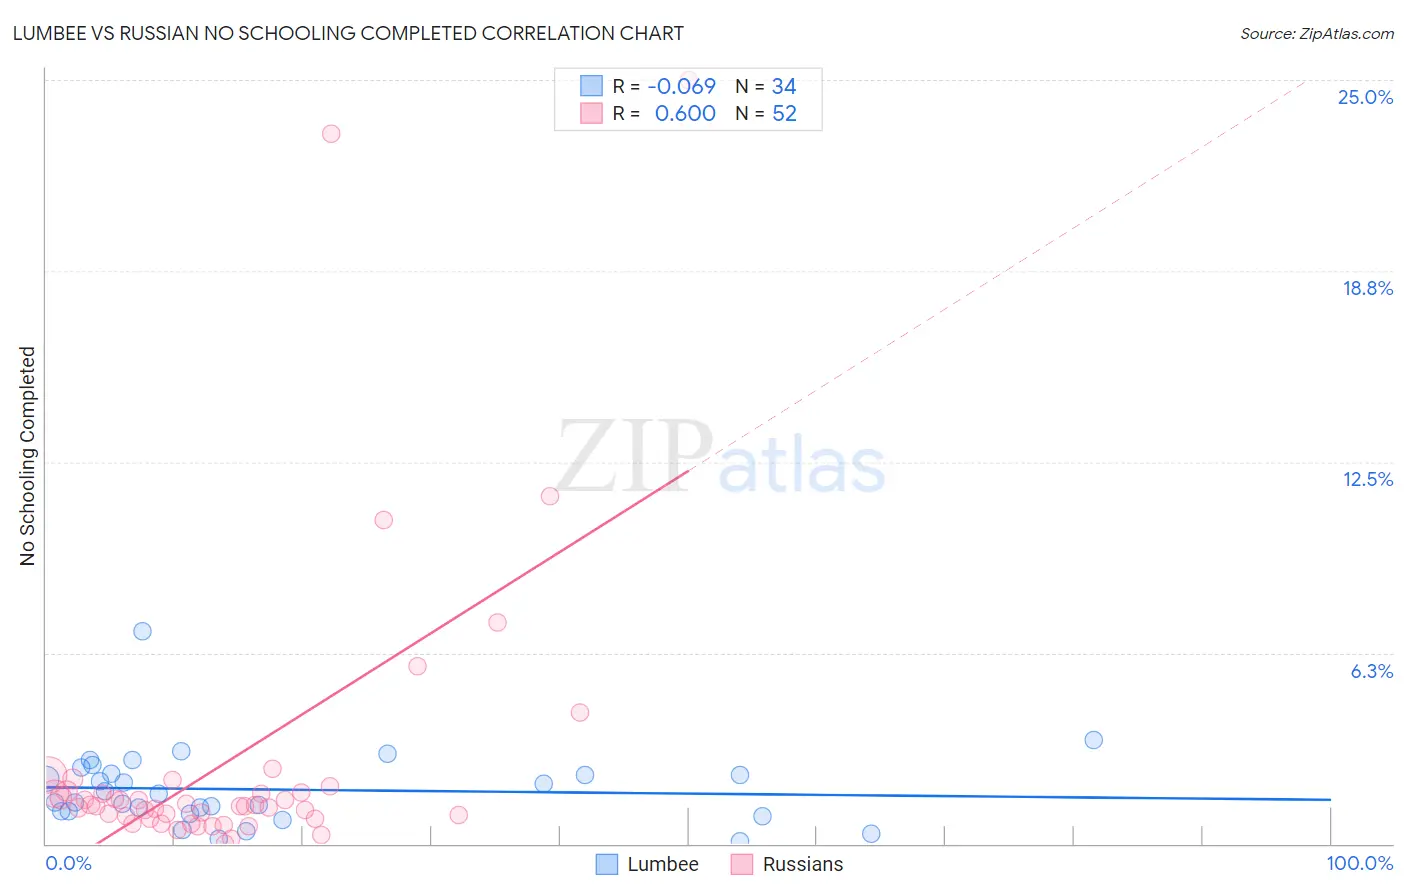
Lumbee vs Russian No Schooling Completed Correlation Chart
The statistical analysis conducted on geographies consisting of 91,955,229 people shows a slight negative correlation between the proportion of Lumbee and percentage of population with no schooling in the United States with a correlation coefficient (R) of -0.069 and weighted average of 1.5%. Similarly, the statistical analysis conducted on geographies consisting of 500,481,409 people shows a significant positive correlation between the proportion of Russians and percentage of population with no schooling in the United States with a correlation coefficient (R) of 0.600 and weighted average of 1.7%, a difference of 10.2%.
No Schooling Completed Correlation Summary
| Measurement | Lumbee | Russian |
| Minimum | 0.093% | 0.017% |
| Maximum | 6.9% | 25.0% |
| Range | 6.9% | 25.0% |
| Mean | 1.8% | 2.7% |
| Median | 1.5% | 1.3% |
| Interquartile 25% (IQ1) | 1.0% | 0.87% |
| Interquartile 75% (IQ3) | 2.3% | 1.7% |
| Interquartile Range (IQR) | 1.2% | 0.83% |
| Standard Deviation (Sample) | 1.3% | 4.9% |
| Standard Deviation (Population) | 1.2% | 4.8% |
Similar Demographics by No Schooling Completed
Demographics Similar to Lumbee by No Schooling Completed
In terms of no schooling completed, the demographic groups most similar to Lumbee are British (1.5%, a difference of 0.48%), Inupiat (1.5%, a difference of 0.51%), French Canadian (1.5%, a difference of 0.91%), Swiss (1.5%, a difference of 0.91%), and Scandinavian (1.5%, a difference of 0.92%).
| Demographics | Rating | Rank | No Schooling Completed |
| Alaska Natives | 100.0 /100 | #22 | Exceptional 1.5% |
| Europeans | 100.0 /100 | #23 | Exceptional 1.5% |
| Pennsylvania Germans | 100.0 /100 | #24 | Exceptional 1.5% |
| French | 100.0 /100 | #25 | Exceptional 1.5% |
| Czechs | 100.0 /100 | #26 | Exceptional 1.5% |
| Scandinavians | 100.0 /100 | #27 | Exceptional 1.5% |
| French Canadians | 100.0 /100 | #28 | Exceptional 1.5% |
| Lumbee | 100.0 /100 | #29 | Exceptional 1.5% |
| British | 100.0 /100 | #30 | Exceptional 1.5% |
| Inupiat | 100.0 /100 | #31 | Exceptional 1.5% |
| Swiss | 100.0 /100 | #32 | Exceptional 1.5% |
| Italians | 100.0 /100 | #33 | Exceptional 1.5% |
| Latvians | 100.0 /100 | #34 | Exceptional 1.5% |
| Eastern Europeans | 100.0 /100 | #35 | Exceptional 1.6% |
| Aleuts | 99.9 /100 | #36 | Exceptional 1.6% |
Demographics Similar to Russians by No Schooling Completed
In terms of no schooling completed, the demographic groups most similar to Russians are Immigrants from Northern Europe (1.7%, a difference of 0.040%), New Zealander (1.7%, a difference of 0.16%), Serbian (1.7%, a difference of 0.20%), Canadian (1.7%, a difference of 0.34%), and Immigrants from Austria (1.7%, a difference of 0.53%).
| Demographics | Rating | Rank | No Schooling Completed |
| Immigrants | North America | 99.8 /100 | #56 | Exceptional 1.6% |
| Austrians | 99.8 /100 | #57 | Exceptional 1.6% |
| Kiowa | 99.8 /100 | #58 | Exceptional 1.6% |
| Slavs | 99.8 /100 | #59 | Exceptional 1.7% |
| Americans | 99.8 /100 | #60 | Exceptional 1.7% |
| Tsimshian | 99.8 /100 | #61 | Exceptional 1.7% |
| Immigrants | Northern Europe | 99.8 /100 | #62 | Exceptional 1.7% |
| Russians | 99.8 /100 | #63 | Exceptional 1.7% |
| New Zealanders | 99.7 /100 | #64 | Exceptional 1.7% |
| Serbians | 99.7 /100 | #65 | Exceptional 1.7% |
| Canadians | 99.7 /100 | #66 | Exceptional 1.7% |
| Immigrants | Austria | 99.7 /100 | #67 | Exceptional 1.7% |
| Immigrants | Lithuania | 99.7 /100 | #68 | Exceptional 1.7% |
| Chickasaw | 99.6 /100 | #69 | Exceptional 1.7% |
| Immigrants | Netherlands | 99.6 /100 | #70 | Exceptional 1.7% |