Immigrants from Morocco vs Immigrants from Malaysia Associate's Degree

COMPARE

Immigrants from Morocco
Race
Ancestry
AfghanAfricanAlaska NativeAlaskan AthabascanAlbanianAleutAlsatianAmericanApacheArabArapahoArgentineanArmenianAssyrian/Chaldean/SyriacAustralianAustrianBahamianBangladeshiBarbadianBasqueBelgianBelizeanBermudanBhutaneseBlackfeetBolivianBrazilianBritishBritish West IndianBulgarianBurmeseCajunCambodianCanadianCape VerdeanCarpatho RusynCelticCentral AmericanCentral American IndianCherokeeCheyenneChickasawChileanChineseChippewaChoctawColombianColvilleComancheCosta RicanCreeCreekCroatianCrowCubanCypriotCzechCzechoslovakianDanishDelawareDominicanDutchDutch West IndianEastern EuropeanEcuadorianEgyptianEnglishEstonianEthiopianEuropeanFijianFilipinoFinnishFrenchFrench American IndianFrench CanadianGermanGerman RussianGhanaianGreekGuamanian/ChamorroGuatemalanGuyaneseHaitianHmongHonduranHopiHoumaHungarianIcelanderIndian (Asian)IndonesianInupiatIranianIraqiIrishIroquoisIsraeliItalianJamaicanJapaneseJordanianKenyanKiowaKoreanLaotianLatvianLebaneseLiberianLithuanianLumbeeLuxembourgerMacedonianMalaysianMalteseMarshalleseMenomineeMexicanMexican American IndianMongolianMoroccanNative HawaiianNavajoNepaleseNew ZealanderNicaraguanNigerianNorthern EuropeanNorwegianOkinawanOsageOttawaPaiutePakistaniPalestinianPanamanianParaguayanPennsylvania GermanPeruvianPimaPolishPortuguesePotawatomiPuebloPuerto RicanPuget Sound SalishRomanianRussianSalvadoranSamoanScandinavianScotch-IrishScottishSeminoleSenegaleseSerbianShoshoneSierra LeoneanSiouxSlavicSlovakSloveneSomaliSouth AfricanSouth AmericanSouth American IndianSoviet UnionSpaniardSpanishSpanish AmericanSpanish American IndianSri LankanSubsaharan AfricanSudaneseSwedishSwissSyrianTaiwaneseThaiTlingit-HaidaTohono O'OdhamTonganTrinidadian and TobagonianTsimshianTurkishU.S. Virgin IslanderUgandanUkrainianUruguayanUteVenezuelanVietnameseWelshWest IndianYakamaYaquiYugoslavianYumanYup'ikZimbabwean
Immigration
NonimmigrantsImmigrantsAfghanistanAfricaAlbaniaArgentinaArmeniaAsiaAustraliaAustriaBahamasBangladeshBarbadosBelarusBelgiumBelizeBoliviaBosnia and HerzegovinaBrazilBulgariaBurma/MyanmarCabo VerdeCambodiaCameroonCanadaCaribbeanCentral AmericaChileChinaColombiaCongoCosta RicaCroatiaCubaCzechoslovakiaDenmarkDominicaDominican RepublicEastern AfricaEastern AsiaEastern EuropeEcuadorEgyptEl SalvadorEnglandEritreaEthiopiaEuropeFijiFranceGermanyGhanaGreeceGrenadaGuatemalaGuyanaHaitiHondurasHong KongHungaryIndiaIndonesiaIranIraqIrelandIsraelItalyJamaicaJapanJordanKazakhstanKenyaKoreaKuwaitLaosLatin AmericaLatviaLebanonLiberiaLithuaniaMexicoMicronesiaMiddle AfricaMoldovaMoroccoNepalNetherlandsNicaraguaNigeriaNorth AmericaNorth MacedoniaNorthern AfricaNorthern EuropeNorwayOceaniaPakistanPanamaPeruPhilippinesPolandPortugalRomaniaRussiaSaudi ArabiaScotlandSenegalSerbiaSierra LeoneSingaporeSomaliaSouth AfricaSouth AmericaSouth Central AsiaSouth Eastern AsiaSouthern EuropeSpainSri LankaSt. Vincent and the GrenadinesSudanSwedenSwitzerlandSyriaTaiwanThailandTrinidad and TobagoTurkeyUgandaUkraineUruguayUzbekistanVenezuelaVietnamWest IndiesWestern AfricaWestern AsiaWestern EuropeYemenZaireZimbabweAzores
Immigrants from Malaysia
Race
Ancestry
AfghanAfricanAlaska NativeAlaskan AthabascanAlbanianAleutAlsatianAmericanApacheArabArapahoArgentineanArmenianAssyrian/Chaldean/SyriacAustralianAustrianBahamianBangladeshiBarbadianBasqueBelgianBelizeanBermudanBhutaneseBlackfeetBolivianBrazilianBritishBritish West IndianBulgarianBurmeseCajunCambodianCanadianCape VerdeanCarpatho RusynCelticCentral AmericanCentral American IndianCherokeeCheyenneChickasawChileanChineseChippewaChoctawColombianColvilleComancheCosta RicanCreeCreekCroatianCrowCubanCypriotCzechCzechoslovakianDanishDelawareDominicanDutchDutch West IndianEastern EuropeanEcuadorianEgyptianEnglishEstonianEthiopianEuropeanFijianFilipinoFinnishFrenchFrench American IndianFrench CanadianGermanGerman RussianGhanaianGreekGuamanian/ChamorroGuatemalanGuyaneseHaitianHmongHonduranHopiHoumaHungarianIcelanderIndian (Asian)IndonesianInupiatIranianIraqiIrishIroquoisIsraeliItalianJamaicanJapaneseJordanianKenyanKiowaKoreanLaotianLatvianLebaneseLiberianLithuanianLumbeeLuxembourgerMacedonianMalaysianMalteseMarshalleseMenomineeMexicanMexican American IndianMongolianMoroccanNative HawaiianNavajoNepaleseNew ZealanderNicaraguanNigerianNorthern EuropeanNorwegianOkinawanOsageOttawaPaiutePakistaniPalestinianPanamanianParaguayanPennsylvania GermanPeruvianPimaPolishPortuguesePotawatomiPuebloPuerto RicanPuget Sound SalishRomanianRussianSalvadoranSamoanScandinavianScotch-IrishScottishSeminoleSenegaleseSerbianShoshoneSierra LeoneanSiouxSlavicSlovakSloveneSomaliSouth AfricanSouth AmericanSouth American IndianSoviet UnionSpaniardSpanishSpanish AmericanSpanish American IndianSri LankanSubsaharan AfricanSudaneseSwedishSwissSyrianTaiwaneseThaiTlingit-HaidaTohono O'OdhamTonganTrinidadian and TobagonianTsimshianTurkishU.S. Virgin IslanderUgandanUkrainianUruguayanUteVenezuelanVietnameseWelshWest IndianYakamaYaquiYugoslavianYumanYup'ikZimbabwean
Immigration
NonimmigrantsImmigrantsAfghanistanAfricaAlbaniaArgentinaArmeniaAsiaAustraliaAustriaBahamasBangladeshBarbadosBelarusBelgiumBelizeBoliviaBosnia and HerzegovinaBrazilBulgariaBurma/MyanmarCabo VerdeCambodiaCameroonCanadaCaribbeanCentral AmericaChileChinaColombiaCongoCosta RicaCroatiaCubaCzechoslovakiaDenmarkDominicaDominican RepublicEastern AfricaEastern AsiaEastern EuropeEcuadorEgyptEl SalvadorEnglandEritreaEthiopiaEuropeFijiFranceGermanyGhanaGreeceGrenadaGuatemalaGuyanaHaitiHondurasHong KongHungaryIndiaIndonesiaIranIraqIrelandIsraelItalyJamaicaJapanJordanKazakhstanKenyaKoreaKuwaitLaosLatin AmericaLatviaLebanonLiberiaLithuaniaMalaysiaMexicoMicronesiaMiddle AfricaMoldovaNepalNetherlandsNicaraguaNigeriaNorth AmericaNorth MacedoniaNorthern AfricaNorthern EuropeNorwayOceaniaPakistanPanamaPeruPhilippinesPolandPortugalRomaniaRussiaSaudi ArabiaScotlandSenegalSerbiaSierra LeoneSingaporeSomaliaSouth AfricaSouth AmericaSouth Central AsiaSouth Eastern AsiaSouthern EuropeSpainSri LankaSt. Vincent and the GrenadinesSudanSwedenSwitzerlandSyriaTaiwanThailandTrinidad and TobagoTurkeyUgandaUkraineUruguayUzbekistanVenezuelaVietnamWest IndiesWestern AfricaWestern AsiaWestern EuropeYemenZaireZimbabweAzores
Associate's Degree
Income
Poverty
Unemployment
Labor Participation
Family Structure
Vehicle Availability
Education Level
Disability

Associate's Degree Comparison

Immigrants from Morocco

Immigrants from Malaysia

Exceptional
Exceptional
49.2%
ASSOCIATE'S DEGREE
96.3/ 100
METRIC RATING
109th/ 347
METRIC RANK
52.5%
ASSOCIATE'S DEGREE
99.9/ 100
METRIC RATING
42nd/ 347
METRIC RANK

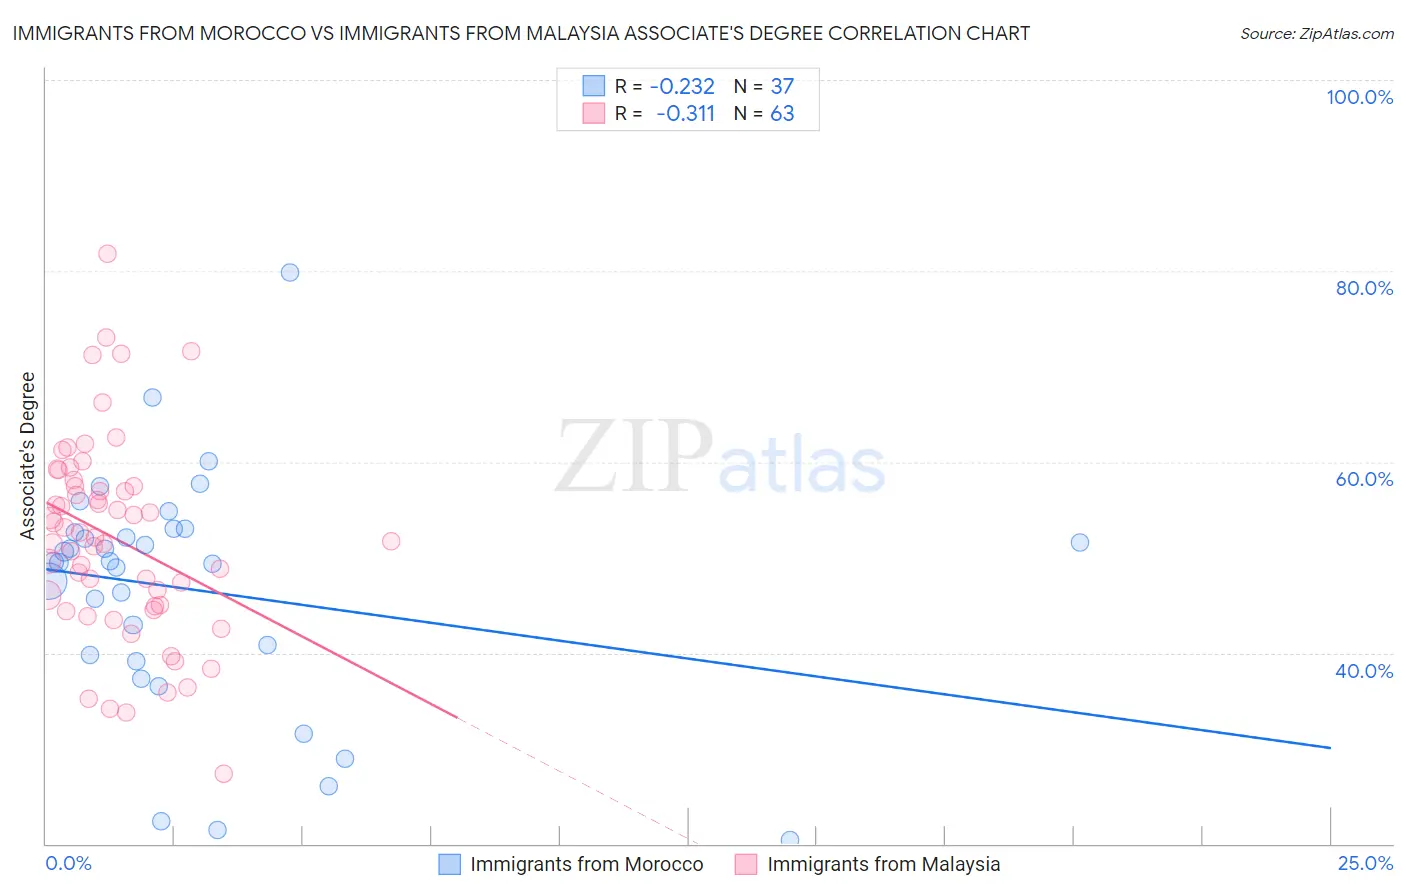
Immigrants from Morocco vs Immigrants from Malaysia Associate's Degree Correlation Chart

The statistical analysis conducted on geographies consisting of 178,912,438 people shows a weak negative correlation between the proportion of Immigrants from Morocco and percentage of population with at least associate's degree education in the United States with a correlation coefficient (R) of -0.232 and weighted average of 49.2%. Similarly, the statistical analysis conducted on geographies consisting of 197,964,670 people shows a mild negative correlation between the proportion of Immigrants from Malaysia and percentage of population with at least associate's degree education in the United States with a correlation coefficient (R) of -0.311 and weighted average of 52.5%, a difference of 6.8%.
Immigrants from Morocco vs Immigrants from Malaysia Associate's Degree

Associate's Degree Correlation Summary

MeasurementImmigrants from MoroccoImmigrants from Malaysia
Minimum20.4%27.3%
Maximum79.9%81.8%
Range59.4%54.5%
Mean46.6%52.0%
Median49.4%52.0%
Interquartile 25% (IQ1)39.4%44.8%
Interquartile 75% (IQ3)52.8%57.5%
Interquartile Range (IQR)13.4%12.6%
Standard Deviation (Sample)12.5%10.5%
Standard Deviation (Population)12.3%10.4%

Similar Demographics by Associate's Degree

Demographics Similar to Immigrants from Morocco by Associate's Degree

In terms of associate's degree, the demographic groups most similar to Immigrants from Morocco are Jordanian (49.2%, a difference of 0.13%), Syrian (49.3%, a difference of 0.20%), Austrian (49.1%, a difference of 0.22%), Croatian (49.3%, a difference of 0.23%), and Immigrants from Italy (49.3%, a difference of 0.23%).
DemographicsRating | RankAssociate's Degree
Chileans
97.3
/100
|
#102
Exceptional
49.4%
Ukrainians
97.1
/100
|
#103
Exceptional
49.4%
Venezuelans
97.0
/100
|
#104
Exceptional
49.4%
Croatians
96.8
/100
|
#105
Exceptional
49.3%
Immigrants | Italy
96.7
/100
|
#106
Exceptional
49.3%
Syrians
96.7
/100
|
#107
Exceptional
49.3%
Jordanians
96.6
/100
|
#108
Exceptional
49.2%
Immigrants | Morocco
96.3
/100
|
#109
Exceptional
49.2%
Austrians
95.8
/100
|
#110
Exceptional
49.1%
Immigrants | Venezuela
95.8
/100
|
#111
Exceptional
49.1%
Immigrants | Chile
95.3
/100
|
#112
Exceptional
49.0%
Palestinians
95.3
/100
|
#113
Exceptional
49.0%
Arabs
95.3
/100
|
#114
Exceptional
49.0%
Luxembourgers
95.1
/100
|
#115
Exceptional
48.9%
British
95.0
/100
|
#116
Exceptional
48.9%

Demographics Similar to Immigrants from Malaysia by Associate's Degree

In terms of associate's degree, the demographic groups most similar to Immigrants from Malaysia are Immigrants from South Africa (52.5%, a difference of 0.010%), Immigrants from Saudi Arabia (52.6%, a difference of 0.030%), Estonian (52.5%, a difference of 0.10%), Immigrants from Lithuania (52.4%, a difference of 0.17%), and Immigrants from Bulgaria (52.4%, a difference of 0.31%).
DemographicsRating | RankAssociate's Degree
Russians
100.0
/100
|
#35
Exceptional
53.2%
Immigrants | Russia
100.0
/100
|
#36
Exceptional
53.1%
Immigrants | Denmark
100.0
/100
|
#37
Exceptional
53.1%
Mongolians
100.0
/100
|
#38
Exceptional
53.0%
Immigrants | Belarus
99.9
/100
|
#39
Exceptional
52.8%
Immigrants | Latvia
99.9
/100
|
#40
Exceptional
52.8%
Immigrants | Saudi Arabia
99.9
/100
|
#41
Exceptional
52.6%
Immigrants | Malaysia
99.9
/100
|
#42
Exceptional
52.5%
Immigrants | South Africa
99.9
/100
|
#43
Exceptional
52.5%
Estonians
99.9
/100
|
#44
Exceptional
52.5%
Immigrants | Lithuania
99.9
/100
|
#45
Exceptional
52.4%
Immigrants | Bulgaria
99.9
/100
|
#46
Exceptional
52.4%
Immigrants | Kuwait
99.9
/100
|
#47
Exceptional
52.4%
Immigrants | Norway
99.9
/100
|
#48
Exceptional
52.2%
Immigrants | Austria
99.9
/100
|
#49
Exceptional
52.1%