Immigrants from Grenada vs Immigrants from Malaysia Associate's Degree
COMPARE
Immigrants from Grenada
Immigrants from Malaysia
Associate's Degree
Associate's Degree Comparison
Immigrants from Grenada
Immigrants from Malaysia
42.6%
ASSOCIATE'S DEGREE
1.3/ 100
METRIC RATING
239th/ 347
METRIC RANK
52.5%
ASSOCIATE'S DEGREE
99.9/ 100
METRIC RATING
42nd/ 347
METRIC RANK
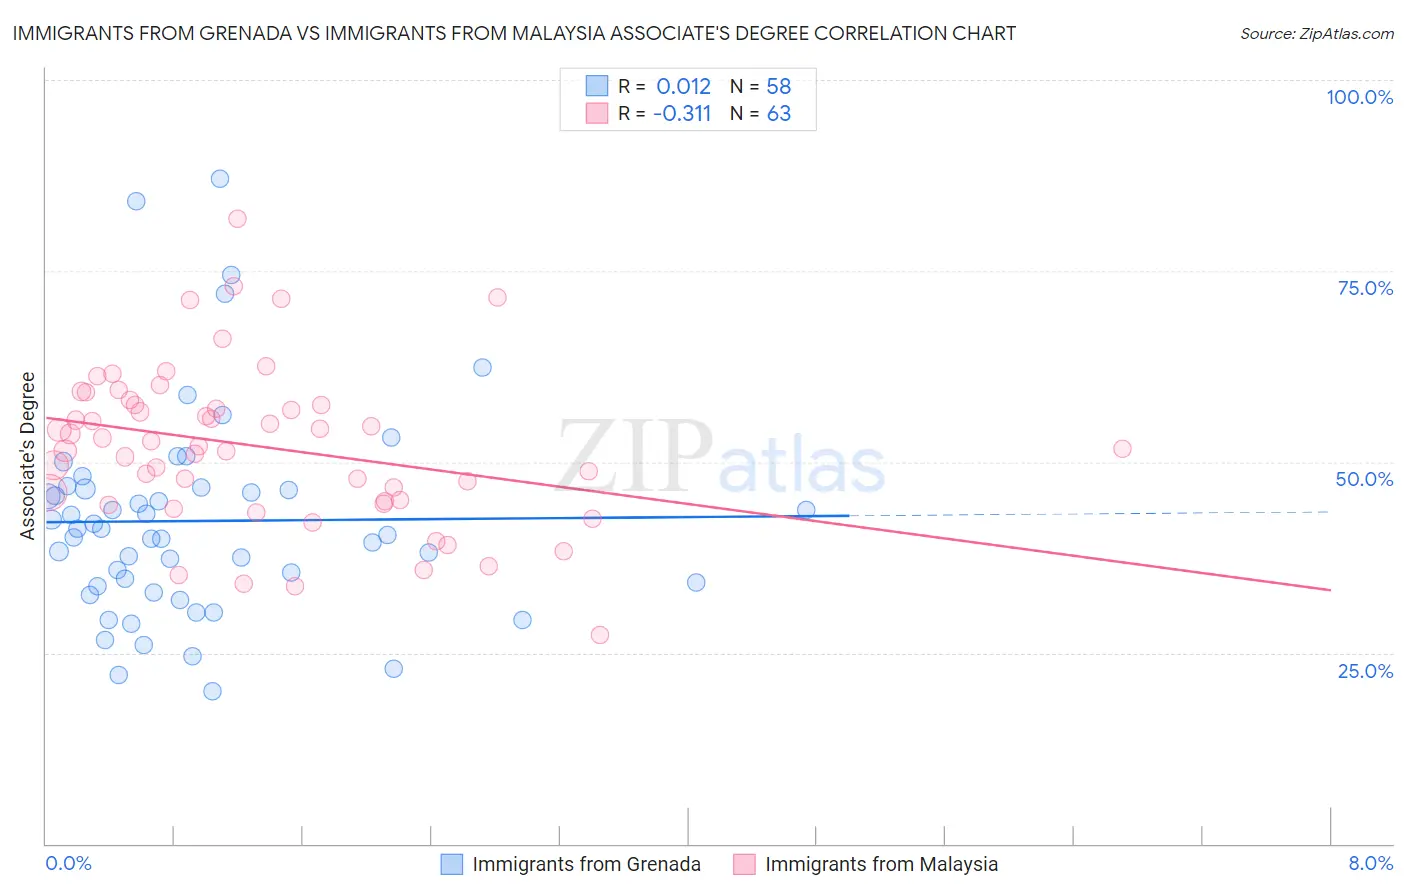
Immigrants from Grenada vs Immigrants from Malaysia Associate's Degree Correlation Chart
The statistical analysis conducted on geographies consisting of 67,201,096 people shows no correlation between the proportion of Immigrants from Grenada and percentage of population with at least associate's degree education in the United States with a correlation coefficient (R) of 0.012 and weighted average of 42.6%. Similarly, the statistical analysis conducted on geographies consisting of 197,964,670 people shows a mild negative correlation between the proportion of Immigrants from Malaysia and percentage of population with at least associate's degree education in the United States with a correlation coefficient (R) of -0.311 and weighted average of 52.5%, a difference of 23.3%.
Associate's Degree Correlation Summary
| Measurement | Immigrants from Grenada | Immigrants from Malaysia |
| Minimum | 20.0% | 27.3% |
| Maximum | 87.1% | 81.8% |
| Range | 67.1% | 54.5% |
| Mean | 42.3% | 52.0% |
| Median | 40.8% | 52.0% |
| Interquartile 25% (IQ1) | 33.8% | 44.8% |
| Interquartile 75% (IQ3) | 46.4% | 57.5% |
| Interquartile Range (IQR) | 12.7% | 12.6% |
| Standard Deviation (Sample) | 13.7% | 10.5% |
| Standard Deviation (Population) | 13.5% | 10.4% |
Similar Demographics by Associate's Degree
Demographics Similar to Immigrants from Grenada by Associate's Degree
In terms of associate's degree, the demographic groups most similar to Immigrants from Grenada are Cree (42.5%, a difference of 0.18%), Iroquois (42.8%, a difference of 0.51%), British West Indian (42.4%, a difference of 0.51%), Immigrants from West Indies (42.4%, a difference of 0.52%), and Guyanese (42.3%, a difference of 0.64%).
| Demographics | Rating | Rank | Associate's Degree |
| Native Hawaiians | 2.3 /100 | #232 | Tragic 43.1% |
| Tongans | 2.2 /100 | #233 | Tragic 43.0% |
| Tlingit-Haida | 2.1 /100 | #234 | Tragic 43.0% |
| Ecuadorians | 2.0 /100 | #235 | Tragic 43.0% |
| Immigrants | St. Vincent and the Grenadines | 1.9 /100 | #236 | Tragic 42.9% |
| Immigrants | Nonimmigrants | 1.9 /100 | #237 | Tragic 42.9% |
| Iroquois | 1.7 /100 | #238 | Tragic 42.8% |
| Immigrants | Grenada | 1.3 /100 | #239 | Tragic 42.6% |
| Cree | 1.2 /100 | #240 | Tragic 42.5% |
| British West Indians | 1.0 /100 | #241 | Tragic 42.4% |
| Immigrants | West Indies | 1.0 /100 | #242 | Tragic 42.4% |
| Guyanese | 1.0 /100 | #243 | Tragic 42.3% |
| Immigrants | Liberia | 0.9 /100 | #244 | Tragic 42.3% |
| Immigrants | Cambodia | 0.9 /100 | #245 | Tragic 42.3% |
| Delaware | 0.9 /100 | #246 | Tragic 42.3% |
Demographics Similar to Immigrants from Malaysia by Associate's Degree
In terms of associate's degree, the demographic groups most similar to Immigrants from Malaysia are Immigrants from South Africa (52.5%, a difference of 0.010%), Immigrants from Saudi Arabia (52.6%, a difference of 0.030%), Estonian (52.5%, a difference of 0.10%), Immigrants from Lithuania (52.4%, a difference of 0.17%), and Immigrants from Bulgaria (52.4%, a difference of 0.31%).
| Demographics | Rating | Rank | Associate's Degree |
| Russians | 100.0 /100 | #35 | Exceptional 53.2% |
| Immigrants | Russia | 100.0 /100 | #36 | Exceptional 53.1% |
| Immigrants | Denmark | 100.0 /100 | #37 | Exceptional 53.1% |
| Mongolians | 100.0 /100 | #38 | Exceptional 53.0% |
| Immigrants | Belarus | 99.9 /100 | #39 | Exceptional 52.8% |
| Immigrants | Latvia | 99.9 /100 | #40 | Exceptional 52.8% |
| Immigrants | Saudi Arabia | 99.9 /100 | #41 | Exceptional 52.6% |
| Immigrants | Malaysia | 99.9 /100 | #42 | Exceptional 52.5% |
| Immigrants | South Africa | 99.9 /100 | #43 | Exceptional 52.5% |
| Estonians | 99.9 /100 | #44 | Exceptional 52.5% |
| Immigrants | Lithuania | 99.9 /100 | #45 | Exceptional 52.4% |
| Immigrants | Bulgaria | 99.9 /100 | #46 | Exceptional 52.4% |
| Immigrants | Kuwait | 99.9 /100 | #47 | Exceptional 52.4% |
| Immigrants | Norway | 99.9 /100 | #48 | Exceptional 52.2% |
| Immigrants | Austria | 99.9 /100 | #49 | Exceptional 52.1% |