Lumbee vs Immigrants from Eastern Africa 6th Grade
COMPARE
Lumbee
Immigrants from Eastern Africa
6th Grade
6th Grade Comparison
Lumbee
Immigrants from Eastern Africa
97.6%
6TH GRADE
99.2/ 100
METRIC RATING
81st/ 347
METRIC RANK
96.6%
6TH GRADE
2.0/ 100
METRIC RATING
237th/ 347
METRIC RANK
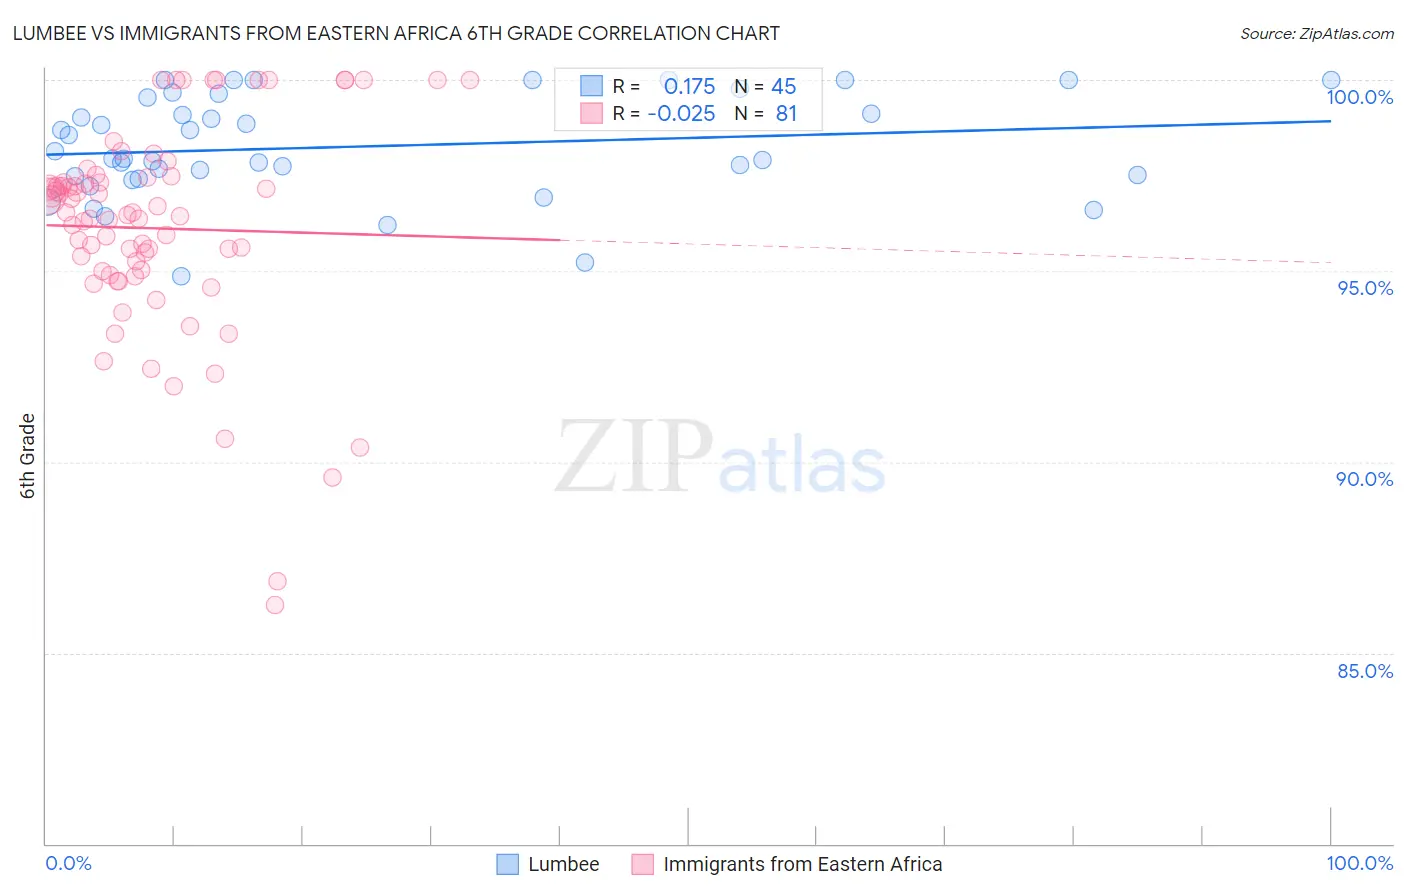
Lumbee vs Immigrants from Eastern Africa 6th Grade Correlation Chart
The statistical analysis conducted on geographies consisting of 92,298,549 people shows a poor positive correlation between the proportion of Lumbee and percentage of population with at least 6th grade education in the United States with a correlation coefficient (R) of 0.175 and weighted average of 97.6%. Similarly, the statistical analysis conducted on geographies consisting of 355,144,184 people shows no correlation between the proportion of Immigrants from Eastern Africa and percentage of population with at least 6th grade education in the United States with a correlation coefficient (R) of -0.025 and weighted average of 96.6%, a difference of 0.99%.
6th Grade Correlation Summary
| Measurement | Lumbee | Immigrants from Eastern Africa |
| Minimum | 94.9% | 86.3% |
| Maximum | 100.0% | 100.0% |
| Range | 5.1% | 13.7% |
| Mean | 98.3% | 96.1% |
| Median | 97.9% | 96.5% |
| Interquartile 25% (IQ1) | 97.5% | 94.9% |
| Interquartile 75% (IQ3) | 99.6% | 97.4% |
| Interquartile Range (IQR) | 2.1% | 2.4% |
| Standard Deviation (Sample) | 1.3% | 2.8% |
| Standard Deviation (Population) | 1.3% | 2.8% |
Similar Demographics by 6th Grade
Demographics Similar to Lumbee by 6th Grade
In terms of 6th grade, the demographic groups most similar to Lumbee are Zimbabwean (97.6%, a difference of 0.0%), Osage (97.6%, a difference of 0.010%), Potawatomi (97.6%, a difference of 0.010%), Immigrants from Lithuania (97.6%, a difference of 0.020%), and Icelander (97.6%, a difference of 0.020%).
| Demographics | Rating | Rank | 6th Grade |
| Immigrants | Netherlands | 99.4 /100 | #74 | Exceptional 97.6% |
| Ukrainians | 99.4 /100 | #75 | Exceptional 97.6% |
| Immigrants | England | 99.4 /100 | #76 | Exceptional 97.6% |
| Immigrants | Lithuania | 99.3 /100 | #77 | Exceptional 97.6% |
| Icelanders | 99.3 /100 | #78 | Exceptional 97.6% |
| Immigrants | India | 99.3 /100 | #79 | Exceptional 97.6% |
| Osage | 99.3 /100 | #80 | Exceptional 97.6% |
| Lumbee | 99.2 /100 | #81 | Exceptional 97.6% |
| Zimbabweans | 99.1 /100 | #82 | Exceptional 97.6% |
| Potawatomi | 99.1 /100 | #83 | Exceptional 97.6% |
| Shoshone | 99.0 /100 | #84 | Exceptional 97.6% |
| Delaware | 98.9 /100 | #85 | Exceptional 97.6% |
| Immigrants | Belgium | 98.9 /100 | #86 | Exceptional 97.5% |
| Puget Sound Salish | 98.9 /100 | #87 | Exceptional 97.5% |
| Immigrants | South Africa | 98.9 /100 | #88 | Exceptional 97.5% |
Demographics Similar to Immigrants from Eastern Africa by 6th Grade
In terms of 6th grade, the demographic groups most similar to Immigrants from Eastern Africa are Immigrants from Indonesia (96.6%, a difference of 0.010%), Nigerian (96.6%, a difference of 0.010%), Indian (Asian) (96.6%, a difference of 0.010%), Korean (96.6%, a difference of 0.010%), and Senegalese (96.6%, a difference of 0.010%).
| Demographics | Rating | Rank | 6th Grade |
| Immigrants | Eastern Asia | 4.0 /100 | #230 | Tragic 96.7% |
| Sub-Saharan Africans | 3.5 /100 | #231 | Tragic 96.7% |
| South American Indians | 3.5 /100 | #232 | Tragic 96.7% |
| Yuman | 3.2 /100 | #233 | Tragic 96.7% |
| Uruguayans | 2.5 /100 | #234 | Tragic 96.6% |
| Asians | 2.4 /100 | #235 | Tragic 96.6% |
| Immigrants | Indonesia | 2.3 /100 | #236 | Tragic 96.6% |
| Immigrants | Eastern Africa | 2.0 /100 | #237 | Tragic 96.6% |
| Nigerians | 1.9 /100 | #238 | Tragic 96.6% |
| Indians (Asian) | 1.9 /100 | #239 | Tragic 96.6% |
| Koreans | 1.9 /100 | #240 | Tragic 96.6% |
| Senegalese | 1.8 /100 | #241 | Tragic 96.6% |
| Immigrants | Asia | 1.8 /100 | #242 | Tragic 96.6% |
| Immigrants | Liberia | 1.6 /100 | #243 | Tragic 96.6% |
| Ethiopians | 1.5 /100 | #244 | Tragic 96.6% |