Immigrants from South Eastern Asia vs Immigrants from Eastern Africa Associate's Degree
COMPARE
Immigrants from South Eastern Asia
Immigrants from Eastern Africa
Associate's Degree
Associate's Degree Comparison
Immigrants from South Eastern Asia
Immigrants from Eastern Africa
45.2%
ASSOCIATE'S DEGREE
20.2/ 100
METRIC RATING
203rd/ 347
METRIC RANK
48.4%
ASSOCIATE'S DEGREE
91.6/ 100
METRIC RATING
128th/ 347
METRIC RANK
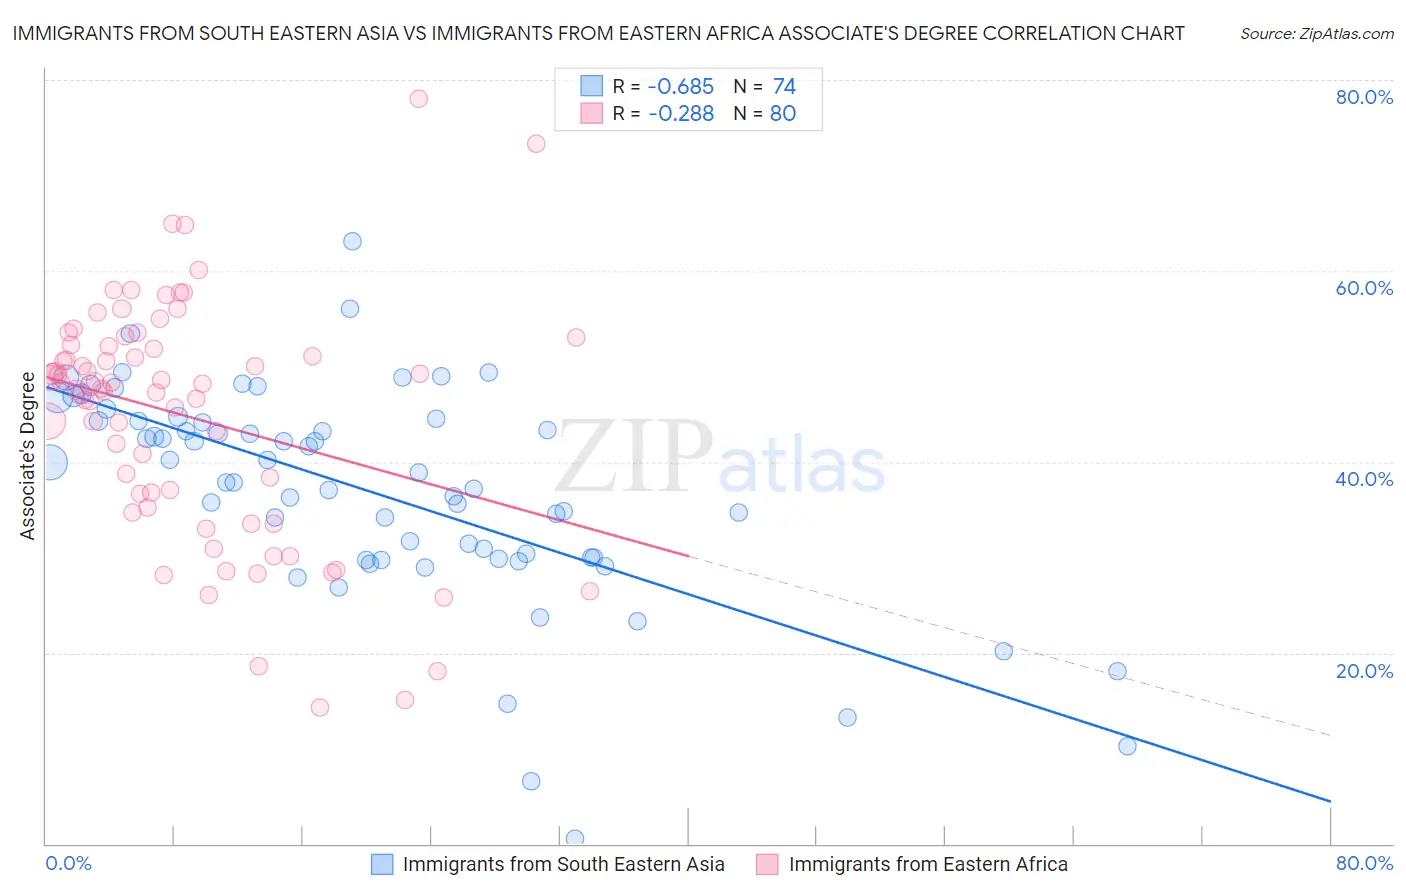
Immigrants from South Eastern Asia vs Immigrants from Eastern Africa Associate's Degree Correlation Chart
The statistical analysis conducted on geographies consisting of 512,661,468 people shows a significant negative correlation between the proportion of Immigrants from South Eastern Asia and percentage of population with at least associate's degree education in the United States with a correlation coefficient (R) of -0.685 and weighted average of 45.2%. Similarly, the statistical analysis conducted on geographies consisting of 355,139,091 people shows a weak negative correlation between the proportion of Immigrants from Eastern Africa and percentage of population with at least associate's degree education in the United States with a correlation coefficient (R) of -0.288 and weighted average of 48.4%, a difference of 7.2%.
Associate's Degree Correlation Summary
| Measurement | Immigrants from South Eastern Asia | Immigrants from Eastern Africa |
| Minimum | 0.50% | 14.3% |
| Maximum | 63.1% | 78.0% |
| Range | 62.6% | 63.7% |
| Mean | 36.9% | 44.8% |
| Median | 38.4% | 47.9% |
| Interquartile 25% (IQ1) | 29.9% | 35.9% |
| Interquartile 75% (IQ3) | 44.3% | 52.2% |
| Interquartile Range (IQR) | 14.4% | 16.2% |
| Standard Deviation (Sample) | 11.4% | 12.5% |
| Standard Deviation (Population) | 11.3% | 12.4% |
Similar Demographics by Associate's Degree
Demographics Similar to Immigrants from South Eastern Asia by Associate's Degree
In terms of associate's degree, the demographic groups most similar to Immigrants from South Eastern Asia are Spaniard (45.2%, a difference of 0.020%), Immigrants from Vietnam (45.2%, a difference of 0.070%), Senegalese (45.2%, a difference of 0.10%), Immigrants from Senegal (45.2%, a difference of 0.11%), and Immigrants from Bangladesh (45.2%, a difference of 0.13%).
| Demographics | Rating | Rank | Associate's Degree |
| French | 25.6 /100 | #196 | Fair 45.4% |
| Scotch-Irish | 22.3 /100 | #197 | Fair 45.3% |
| Immigrants | Bangladesh | 21.3 /100 | #198 | Fair 45.2% |
| Immigrants | Senegal | 21.2 /100 | #199 | Fair 45.2% |
| Senegalese | 21.1 /100 | #200 | Fair 45.2% |
| Immigrants | Vietnam | 20.8 /100 | #201 | Fair 45.2% |
| Spaniards | 20.4 /100 | #202 | Fair 45.2% |
| Immigrants | South Eastern Asia | 20.2 /100 | #203 | Fair 45.2% |
| Nigerians | 19.1 /100 | #204 | Poor 45.1% |
| Immigrants | Thailand | 18.9 /100 | #205 | Poor 45.1% |
| German Russians | 18.9 /100 | #206 | Poor 45.1% |
| Panamanians | 18.4 /100 | #207 | Poor 45.1% |
| Dutch | 17.6 /100 | #208 | Poor 45.0% |
| Immigrants | Costa Rica | 16.7 /100 | #209 | Poor 45.0% |
| Immigrants | Philippines | 16.7 /100 | #210 | Poor 45.0% |
Demographics Similar to Immigrants from Eastern Africa by Associate's Degree
In terms of associate's degree, the demographic groups most similar to Immigrants from Eastern Africa are Swedish (48.4%, a difference of 0.030%), Immigrants from Jordan (48.4%, a difference of 0.090%), Immigrants from Uganda (48.5%, a difference of 0.12%), Immigrants from Syria (48.5%, a difference of 0.13%), and Icelander (48.3%, a difference of 0.19%).
| Demographics | Rating | Rank | Associate's Degree |
| Ugandans | 93.9 /100 | #121 | Exceptional 48.7% |
| Italians | 93.9 /100 | #122 | Exceptional 48.7% |
| Brazilians | 93.7 /100 | #123 | Exceptional 48.7% |
| Serbians | 92.6 /100 | #124 | Exceptional 48.5% |
| Chinese | 92.5 /100 | #125 | Exceptional 48.5% |
| Immigrants | Syria | 92.2 /100 | #126 | Exceptional 48.5% |
| Immigrants | Uganda | 92.1 /100 | #127 | Exceptional 48.5% |
| Immigrants | Eastern Africa | 91.6 /100 | #128 | Exceptional 48.4% |
| Swedes | 91.5 /100 | #129 | Exceptional 48.4% |
| Immigrants | Jordan | 91.2 /100 | #130 | Exceptional 48.4% |
| Icelanders | 90.8 /100 | #131 | Exceptional 48.3% |
| Immigrants | Albania | 89.9 /100 | #132 | Excellent 48.2% |
| Assyrians/Chaldeans/Syriacs | 89.4 /100 | #133 | Excellent 48.2% |
| Moroccans | 89.3 /100 | #134 | Excellent 48.2% |
| Europeans | 89.0 /100 | #135 | Excellent 48.2% |