Immigrants from Ecuador vs Danish Doctorate Degree
COMPARE
Immigrants from Ecuador
Danish
Doctorate Degree
Doctorate Degree Comparison
Immigrants from Ecuador
Danes
1.4%
DOCTORATE DEGREE
0.2/ 100
METRIC RATING
296th/ 347
METRIC RANK
1.9%
DOCTORATE DEGREE
71.9/ 100
METRIC RATING
157th/ 347
METRIC RANK
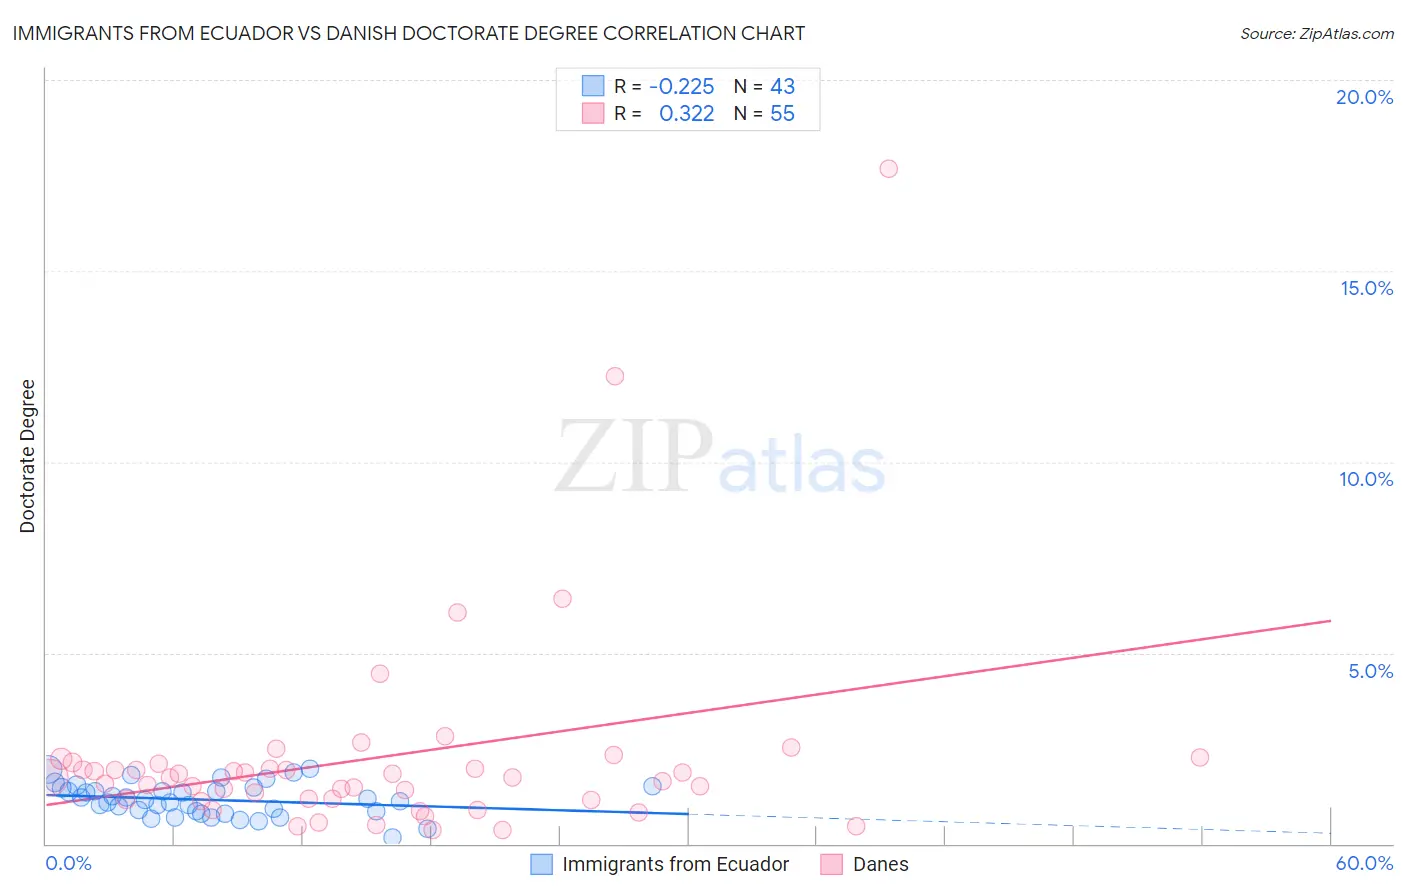
Immigrants from Ecuador vs Danish Doctorate Degree Correlation Chart
The statistical analysis conducted on geographies consisting of 269,753,528 people shows a weak negative correlation between the proportion of Immigrants from Ecuador and percentage of population with at least doctorate degree education in the United States with a correlation coefficient (R) of -0.225 and weighted average of 1.4%. Similarly, the statistical analysis conducted on geographies consisting of 464,600,564 people shows a mild positive correlation between the proportion of Danes and percentage of population with at least doctorate degree education in the United States with a correlation coefficient (R) of 0.322 and weighted average of 1.9%, a difference of 35.0%.
Doctorate Degree Correlation Summary
| Measurement | Immigrants from Ecuador | Danish |
| Minimum | 0.16% | 0.36% |
| Maximum | 2.0% | 17.7% |
| Range | 1.8% | 17.3% |
| Mean | 1.2% | 2.3% |
| Median | 1.2% | 1.7% |
| Interquartile 25% (IQ1) | 0.84% | 1.2% |
| Interquartile 75% (IQ3) | 1.5% | 2.1% |
| Interquartile Range (IQR) | 0.62% | 0.94% |
| Standard Deviation (Sample) | 0.42% | 2.8% |
| Standard Deviation (Population) | 0.42% | 2.8% |
Similar Demographics by Doctorate Degree
Demographics Similar to Immigrants from Ecuador by Doctorate Degree
In terms of doctorate degree, the demographic groups most similar to Immigrants from Ecuador are Tsimshian (1.4%, a difference of 0.22%), Guatemalan (1.4%, a difference of 0.23%), Puerto Rican (1.4%, a difference of 0.63%), Samoan (1.4%, a difference of 0.94%), and Belizean (1.4%, a difference of 1.1%).
| Demographics | Rating | Rank | Doctorate Degree |
| Cape Verdeans | 0.3 /100 | #289 | Tragic 1.4% |
| Choctaw | 0.3 /100 | #290 | Tragic 1.4% |
| Blacks/African Americans | 0.3 /100 | #291 | Tragic 1.4% |
| Alaska Natives | 0.3 /100 | #292 | Tragic 1.4% |
| Immigrants | Yemen | 0.2 /100 | #293 | Tragic 1.4% |
| Samoans | 0.2 /100 | #294 | Tragic 1.4% |
| Guatemalans | 0.2 /100 | #295 | Tragic 1.4% |
| Immigrants | Ecuador | 0.2 /100 | #296 | Tragic 1.4% |
| Tsimshian | 0.2 /100 | #297 | Tragic 1.4% |
| Puerto Ricans | 0.1 /100 | #298 | Tragic 1.4% |
| Belizeans | 0.1 /100 | #299 | Tragic 1.4% |
| Immigrants | Guatemala | 0.1 /100 | #300 | Tragic 1.4% |
| Hondurans | 0.1 /100 | #301 | Tragic 1.4% |
| Shoshone | 0.1 /100 | #302 | Tragic 1.4% |
| Immigrants | Dominica | 0.1 /100 | #303 | Tragic 1.4% |
Demographics Similar to Danes by Doctorate Degree
In terms of doctorate degree, the demographic groups most similar to Danes are Hungarian (1.9%, a difference of 0.030%), Slavic (1.9%, a difference of 0.090%), Polish (1.9%, a difference of 0.14%), Immigrants from Albania (1.9%, a difference of 0.16%), and Slovene (1.9%, a difference of 0.29%).
| Demographics | Rating | Rank | Doctorate Degree |
| English | 75.9 /100 | #150 | Good 1.9% |
| Albanians | 74.8 /100 | #151 | Good 1.9% |
| Immigrants | Kenya | 74.3 /100 | #152 | Good 1.9% |
| Immigrants | Oceania | 74.0 /100 | #153 | Good 1.9% |
| Immigrants | Albania | 72.8 /100 | #154 | Good 1.9% |
| Poles | 72.7 /100 | #155 | Good 1.9% |
| Slavs | 72.4 /100 | #156 | Good 1.9% |
| Danes | 71.9 /100 | #157 | Good 1.9% |
| Hungarians | 71.7 /100 | #158 | Good 1.9% |
| Slovenes | 70.2 /100 | #159 | Good 1.9% |
| Welsh | 69.7 /100 | #160 | Good 1.9% |
| Immigrants | Middle Africa | 68.8 /100 | #161 | Good 1.9% |
| Irish | 67.5 /100 | #162 | Good 1.9% |
| Czechs | 67.3 /100 | #163 | Good 1.9% |
| Celtics | 66.7 /100 | #164 | Good 1.9% |