Canadian vs Danish Doctorate Degree
COMPARE
Canadian
Danish
Doctorate Degree
Doctorate Degree Comparison
Canadians
Danes
2.0%
DOCTORATE DEGREE
90.6/ 100
METRIC RATING
129th/ 347
METRIC RANK
1.9%
DOCTORATE DEGREE
71.9/ 100
METRIC RATING
157th/ 347
METRIC RANK
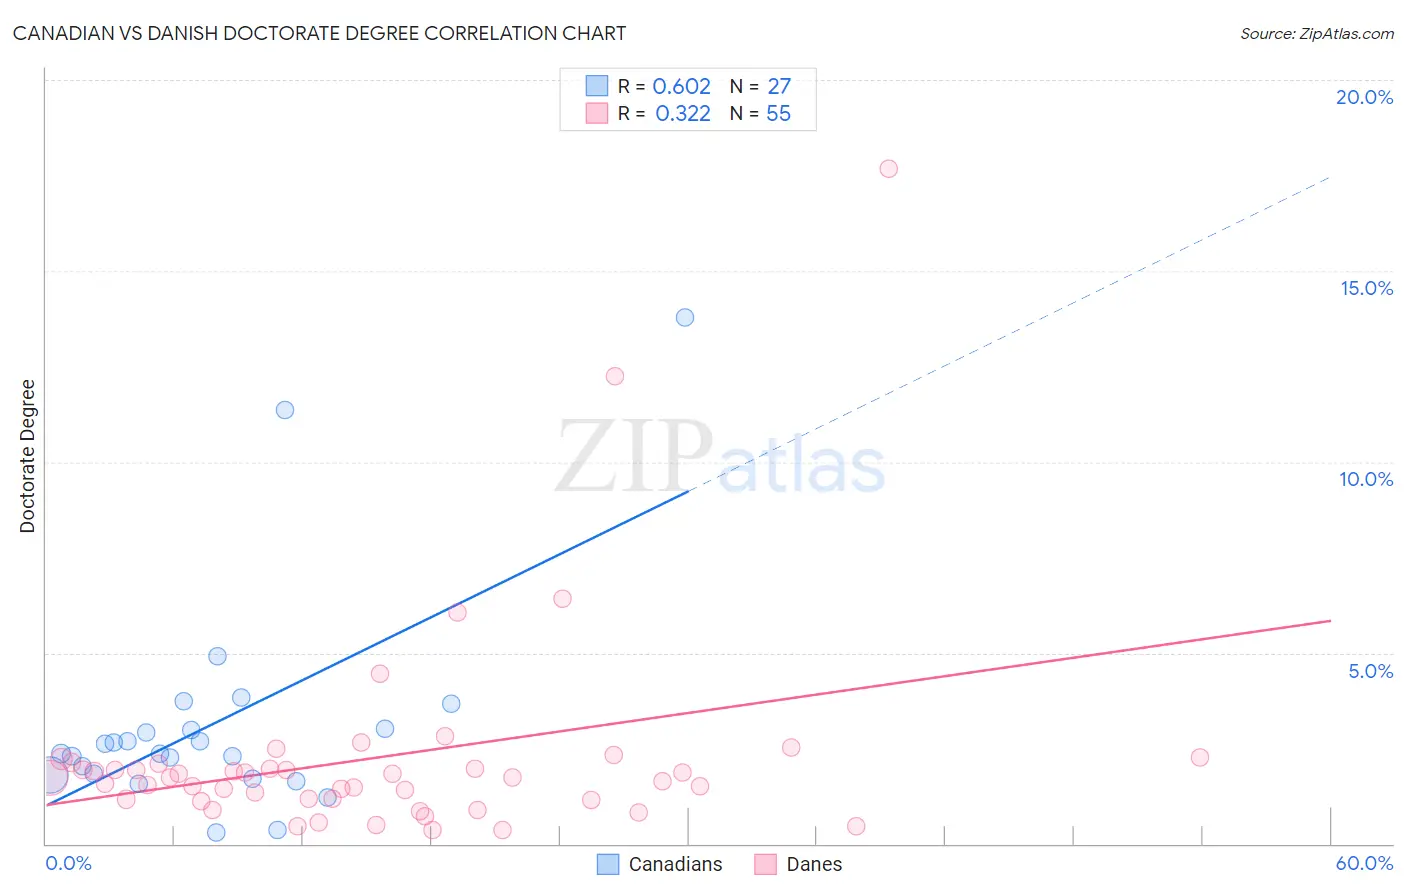
Canadian vs Danish Doctorate Degree Correlation Chart
The statistical analysis conducted on geographies consisting of 431,466,158 people shows a significant positive correlation between the proportion of Canadians and percentage of population with at least doctorate degree education in the United States with a correlation coefficient (R) of 0.602 and weighted average of 2.0%. Similarly, the statistical analysis conducted on geographies consisting of 464,600,564 people shows a mild positive correlation between the proportion of Danes and percentage of population with at least doctorate degree education in the United States with a correlation coefficient (R) of 0.322 and weighted average of 1.9%, a difference of 4.7%.
Doctorate Degree Correlation Summary
| Measurement | Canadian | Danish |
| Minimum | 0.28% | 0.36% |
| Maximum | 13.8% | 17.7% |
| Range | 13.5% | 17.3% |
| Mean | 3.1% | 2.3% |
| Median | 2.4% | 1.7% |
| Interquartile 25% (IQ1) | 1.8% | 1.2% |
| Interquartile 75% (IQ3) | 3.0% | 2.1% |
| Interquartile Range (IQR) | 1.2% | 0.94% |
| Standard Deviation (Sample) | 2.9% | 2.8% |
| Standard Deviation (Population) | 2.9% | 2.8% |
Similar Demographics by Doctorate Degree
Demographics Similar to Canadians by Doctorate Degree
In terms of doctorate degree, the demographic groups most similar to Canadians are Immigrants from Ukraine (2.0%, a difference of 0.010%), Immigrants from Sierra Leone (2.0%, a difference of 0.14%), Immigrants from Zaire (2.0%, a difference of 0.22%), Scottish (2.0%, a difference of 0.42%), and Immigrants from Uzbekistan (2.0%, a difference of 0.47%).
| Demographics | Rating | Rank | Doctorate Degree |
| Immigrants | Southern Europe | 94.7 /100 | #122 | Exceptional 2.0% |
| Croatians | 94.0 /100 | #123 | Exceptional 2.0% |
| Ute | 93.2 /100 | #124 | Exceptional 2.0% |
| Moroccans | 93.0 /100 | #125 | Exceptional 2.0% |
| Jordanians | 92.1 /100 | #126 | Exceptional 2.0% |
| Palestinians | 92.0 /100 | #127 | Exceptional 2.0% |
| Immigrants | Zaire | 91.1 /100 | #128 | Exceptional 2.0% |
| Canadians | 90.6 /100 | #129 | Exceptional 2.0% |
| Immigrants | Ukraine | 90.5 /100 | #130 | Exceptional 2.0% |
| Immigrants | Sierra Leone | 90.2 /100 | #131 | Exceptional 2.0% |
| Scottish | 89.4 /100 | #132 | Excellent 2.0% |
| Immigrants | Uzbekistan | 89.3 /100 | #133 | Excellent 2.0% |
| Immigrants | Cameroon | 88.9 /100 | #134 | Excellent 2.0% |
| Serbians | 88.7 /100 | #135 | Excellent 2.0% |
| Swedes | 88.3 /100 | #136 | Excellent 2.0% |
Demographics Similar to Danes by Doctorate Degree
In terms of doctorate degree, the demographic groups most similar to Danes are Hungarian (1.9%, a difference of 0.030%), Slavic (1.9%, a difference of 0.090%), Polish (1.9%, a difference of 0.14%), Immigrants from Albania (1.9%, a difference of 0.16%), and Slovene (1.9%, a difference of 0.29%).
| Demographics | Rating | Rank | Doctorate Degree |
| English | 75.9 /100 | #150 | Good 1.9% |
| Albanians | 74.8 /100 | #151 | Good 1.9% |
| Immigrants | Kenya | 74.3 /100 | #152 | Good 1.9% |
| Immigrants | Oceania | 74.0 /100 | #153 | Good 1.9% |
| Immigrants | Albania | 72.8 /100 | #154 | Good 1.9% |
| Poles | 72.7 /100 | #155 | Good 1.9% |
| Slavs | 72.4 /100 | #156 | Good 1.9% |
| Danes | 71.9 /100 | #157 | Good 1.9% |
| Hungarians | 71.7 /100 | #158 | Good 1.9% |
| Slovenes | 70.2 /100 | #159 | Good 1.9% |
| Welsh | 69.7 /100 | #160 | Good 1.9% |
| Immigrants | Middle Africa | 68.8 /100 | #161 | Good 1.9% |
| Irish | 67.5 /100 | #162 | Good 1.9% |
| Czechs | 67.3 /100 | #163 | Good 1.9% |
| Celtics | 66.7 /100 | #164 | Good 1.9% |