Immigrants from Armenia vs Immigrants from Oceania College, Under 1 year
COMPARE
Immigrants from Armenia
Immigrants from Oceania
College, Under 1 year
College, Under 1 year Comparison
Immigrants from Armenia
Immigrants from Oceania
64.7%
COLLEGE, UNDER 1 YEAR
28.1/ 100
METRIC RATING
191st/ 347
METRIC RANK
65.6%
COLLEGE, UNDER 1 YEAR
55.0/ 100
METRIC RATING
171st/ 347
METRIC RANK
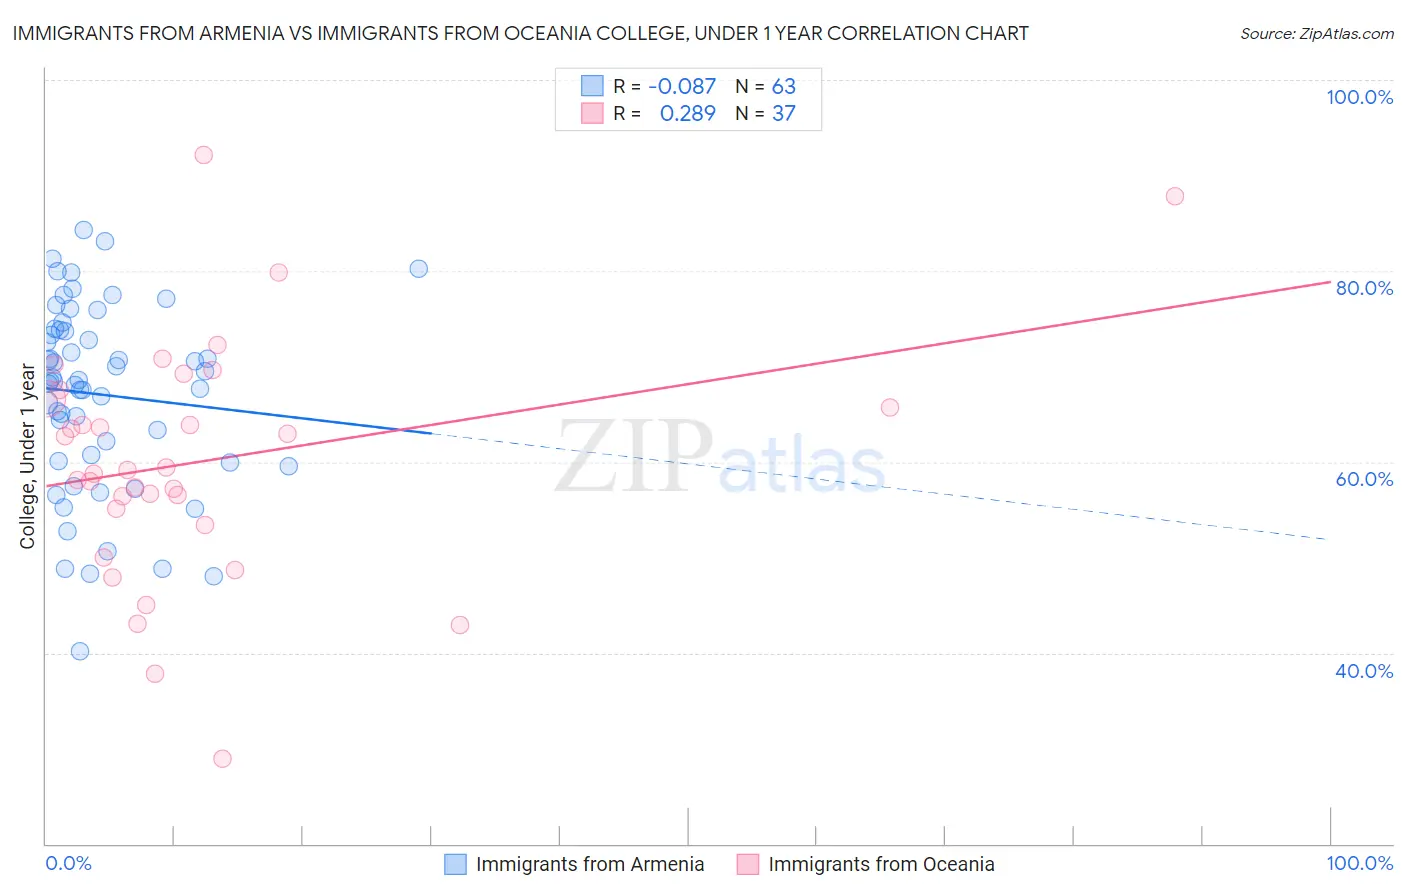
Immigrants from Armenia vs Immigrants from Oceania College, Under 1 year Correlation Chart
The statistical analysis conducted on geographies consisting of 97,725,183 people shows a slight negative correlation between the proportion of Immigrants from Armenia and percentage of population with at least college, under 1 year education in the United States with a correlation coefficient (R) of -0.087 and weighted average of 64.7%. Similarly, the statistical analysis conducted on geographies consisting of 305,519,500 people shows a weak positive correlation between the proportion of Immigrants from Oceania and percentage of population with at least college, under 1 year education in the United States with a correlation coefficient (R) of 0.289 and weighted average of 65.6%, a difference of 1.3%.
College, Under 1 year Correlation Summary
| Measurement | Immigrants from Armenia | Immigrants from Oceania |
| Minimum | 40.2% | 28.9% |
| Maximum | 84.3% | 92.2% |
| Range | 44.1% | 63.2% |
| Mean | 67.0% | 60.1% |
| Median | 68.4% | 59.2% |
| Interquartile 25% (IQ1) | 60.1% | 54.3% |
| Interquartile 75% (IQ3) | 73.8% | 67.1% |
| Interquartile Range (IQR) | 13.6% | 12.8% |
| Standard Deviation (Sample) | 9.7% | 12.6% |
| Standard Deviation (Population) | 9.7% | 12.4% |
Demographics Similar to Immigrants from Armenia and Immigrants from Oceania by College, Under 1 year
In terms of college, under 1 year, the demographic groups most similar to Immigrants from Armenia are Immigrants from Philippines (64.8%, a difference of 0.11%), Spanish (64.9%, a difference of 0.19%), Immigrants from Albania (64.9%, a difference of 0.21%), Immigrants from Southern Europe (64.9%, a difference of 0.32%), and Immigrants from Sierra Leone (65.1%, a difference of 0.58%). Similarly, the demographic groups most similar to Immigrants from Oceania are South American Indian (65.5%, a difference of 0.030%), Swiss (65.5%, a difference of 0.050%), Immigrants from Bosnia and Herzegovina (65.4%, a difference of 0.22%), Scotch-Irish (65.4%, a difference of 0.24%), and French (65.4%, a difference of 0.27%).
| Demographics | Rating | Rank | College, Under 1 year |
| Immigrants | Oceania | 55.0 /100 | #171 | Average 65.6% |
| South American Indians | 54.4 /100 | #172 | Average 65.5% |
| Swiss | 53.9 /100 | #173 | Average 65.5% |
| Immigrants | Bosnia and Herzegovina | 50.0 /100 | #174 | Average 65.4% |
| Scotch-Irish | 49.5 /100 | #175 | Average 65.4% |
| French | 48.9 /100 | #176 | Average 65.4% |
| Immigrants | North Macedonia | 48.6 /100 | #177 | Average 65.4% |
| German Russians | 48.3 /100 | #178 | Average 65.4% |
| Guamanians/Chamorros | 48.2 /100 | #179 | Average 65.4% |
| Dutch | 46.1 /100 | #180 | Average 65.3% |
| Spaniards | 45.5 /100 | #181 | Average 65.3% |
| Immigrants | Africa | 44.7 /100 | #182 | Average 65.3% |
| Immigrants | Poland | 42.6 /100 | #183 | Average 65.2% |
| Bermudans | 42.0 /100 | #184 | Average 65.2% |
| Sri Lankans | 41.7 /100 | #185 | Average 65.2% |
| Immigrants | Sierra Leone | 39.7 /100 | #186 | Fair 65.1% |
| Immigrants | Southern Europe | 34.3 /100 | #187 | Fair 64.9% |
| Immigrants | Albania | 32.0 /100 | #188 | Fair 64.9% |
| Spanish | 31.6 /100 | #189 | Fair 64.9% |
| Immigrants | Philippines | 30.1 /100 | #190 | Fair 64.8% |
| Immigrants | Armenia | 28.1 /100 | #191 | Fair 64.7% |