Paraguayan vs Immigrants from Oceania College, Under 1 year
COMPARE
Paraguayan
Immigrants from Oceania
College, Under 1 year
College, Under 1 year Comparison
Paraguayans
Immigrants from Oceania
67.9%
COLLEGE, UNDER 1 YEAR
97.1/ 100
METRIC RATING
98th/ 347
METRIC RANK
65.6%
COLLEGE, UNDER 1 YEAR
55.0/ 100
METRIC RATING
171st/ 347
METRIC RANK
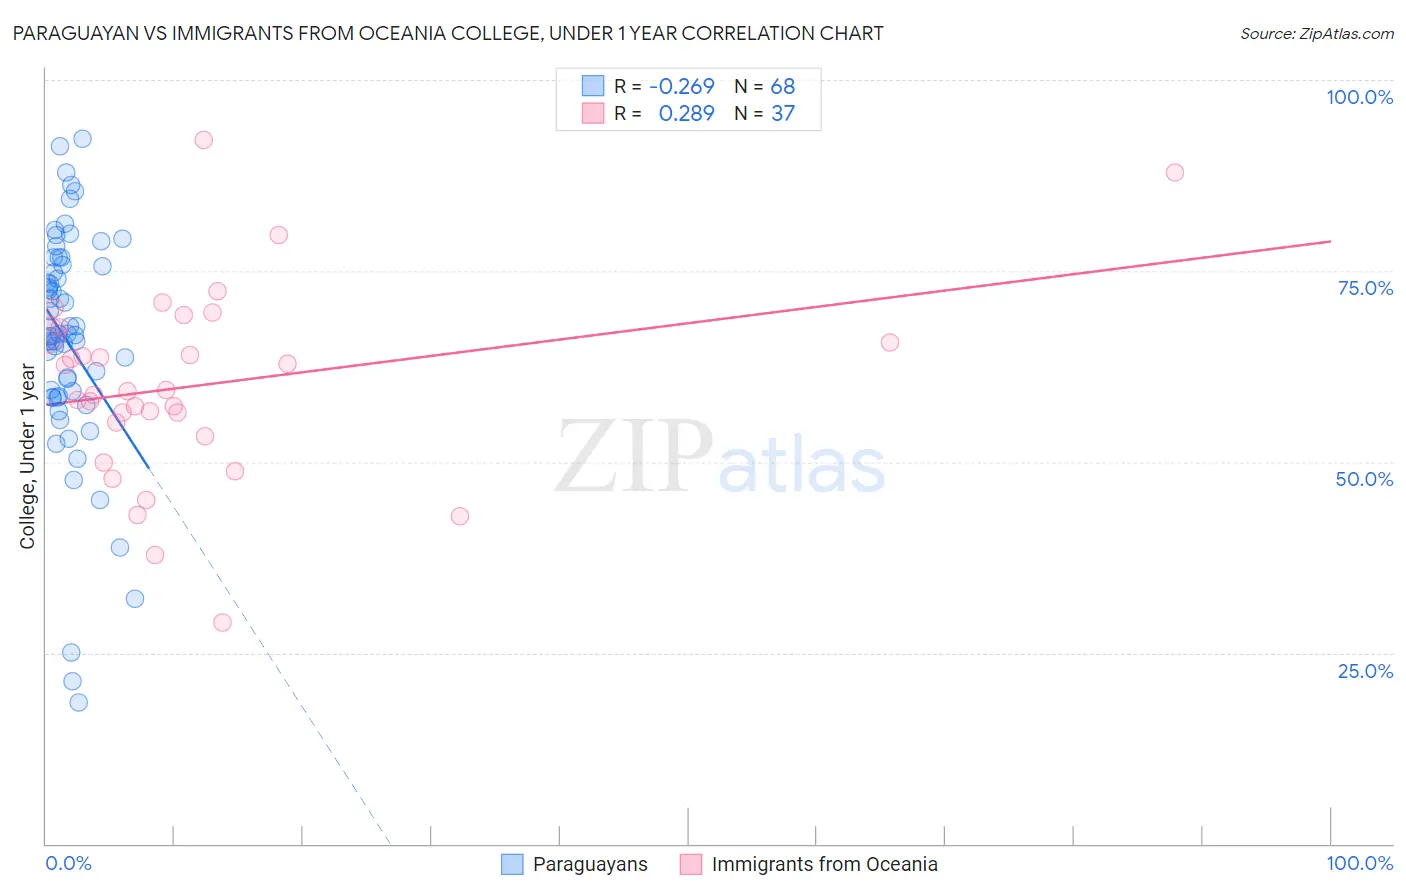
Paraguayan vs Immigrants from Oceania College, Under 1 year Correlation Chart
The statistical analysis conducted on geographies consisting of 95,113,072 people shows a weak negative correlation between the proportion of Paraguayans and percentage of population with at least college, under 1 year education in the United States with a correlation coefficient (R) of -0.269 and weighted average of 67.9%. Similarly, the statistical analysis conducted on geographies consisting of 305,519,500 people shows a weak positive correlation between the proportion of Immigrants from Oceania and percentage of population with at least college, under 1 year education in the United States with a correlation coefficient (R) of 0.289 and weighted average of 65.6%, a difference of 3.6%.
College, Under 1 year Correlation Summary
| Measurement | Paraguayan | Immigrants from Oceania |
| Minimum | 18.4% | 28.9% |
| Maximum | 92.3% | 92.2% |
| Range | 73.8% | 63.2% |
| Mean | 65.7% | 60.1% |
| Median | 66.7% | 59.2% |
| Interquartile 25% (IQ1) | 58.5% | 54.3% |
| Interquartile 75% (IQ3) | 75.7% | 67.1% |
| Interquartile Range (IQR) | 17.1% | 12.8% |
| Standard Deviation (Sample) | 15.1% | 12.6% |
| Standard Deviation (Population) | 15.0% | 12.4% |
Similar Demographics by College, Under 1 year
Demographics Similar to Paraguayans by College, Under 1 year
In terms of college, under 1 year, the demographic groups most similar to Paraguayans are Immigrants from Bolivia (67.9%, a difference of 0.020%), Immigrants from Argentina (67.9%, a difference of 0.030%), Immigrants from Eastern Europe (67.9%, a difference of 0.080%), Palestinian (67.9%, a difference of 0.080%), and Carpatho Rusyn (67.9%, a difference of 0.090%).
| Demographics | Rating | Rank | College, Under 1 year |
| Europeans | 98.1 /100 | #91 | Exceptional 68.2% |
| Luxembourgers | 98.1 /100 | #92 | Exceptional 68.2% |
| Romanians | 97.9 /100 | #93 | Exceptional 68.2% |
| Armenians | 97.7 /100 | #94 | Exceptional 68.1% |
| Immigrants | Pakistan | 97.5 /100 | #95 | Exceptional 68.0% |
| Jordanians | 97.4 /100 | #96 | Exceptional 68.0% |
| Immigrants | Ethiopia | 97.3 /100 | #97 | Exceptional 68.0% |
| Paraguayans | 97.1 /100 | #98 | Exceptional 67.9% |
| Immigrants | Bolivia | 97.0 /100 | #99 | Exceptional 67.9% |
| Immigrants | Argentina | 97.0 /100 | #100 | Exceptional 67.9% |
| Immigrants | Eastern Europe | 96.9 /100 | #101 | Exceptional 67.9% |
| Palestinians | 96.9 /100 | #102 | Exceptional 67.9% |
| Carpatho Rusyns | 96.8 /100 | #103 | Exceptional 67.9% |
| Immigrants | Western Asia | 96.6 /100 | #104 | Exceptional 67.8% |
| Afghans | 96.6 /100 | #105 | Exceptional 67.8% |
Demographics Similar to Immigrants from Oceania by College, Under 1 year
In terms of college, under 1 year, the demographic groups most similar to Immigrants from Oceania are Yugoslavian (65.6%, a difference of 0.030%), German (65.6%, a difference of 0.030%), South American Indian (65.5%, a difference of 0.030%), Hungarian (65.6%, a difference of 0.040%), and Swiss (65.5%, a difference of 0.050%).
| Demographics | Rating | Rank | College, Under 1 year |
| Czechoslovakians | 62.6 /100 | #164 | Good 65.8% |
| Immigrants | Uzbekistan | 61.6 /100 | #165 | Good 65.8% |
| Moroccans | 56.7 /100 | #166 | Average 65.6% |
| Immigrants | Somalia | 56.4 /100 | #167 | Average 65.6% |
| Hungarians | 55.9 /100 | #168 | Average 65.6% |
| Yugoslavians | 55.7 /100 | #169 | Average 65.6% |
| Germans | 55.7 /100 | #170 | Average 65.6% |
| Immigrants | Oceania | 55.0 /100 | #171 | Average 65.6% |
| South American Indians | 54.4 /100 | #172 | Average 65.5% |
| Swiss | 53.9 /100 | #173 | Average 65.5% |
| Immigrants | Bosnia and Herzegovina | 50.0 /100 | #174 | Average 65.4% |
| Scotch-Irish | 49.5 /100 | #175 | Average 65.4% |
| French | 48.9 /100 | #176 | Average 65.4% |
| Immigrants | North Macedonia | 48.6 /100 | #177 | Average 65.4% |
| German Russians | 48.3 /100 | #178 | Average 65.4% |