Romanian vs Immigrants from Netherlands No Schooling Completed
COMPARE
Romanian
Immigrants from Netherlands
No Schooling Completed
No Schooling Completed Comparison
Romanians
Immigrants from Netherlands
1.8%
NO SCHOOLING COMPLETED
98.8/ 100
METRIC RATING
92nd/ 347
METRIC RANK
1.7%
NO SCHOOLING COMPLETED
99.6/ 100
METRIC RATING
70th/ 347
METRIC RANK
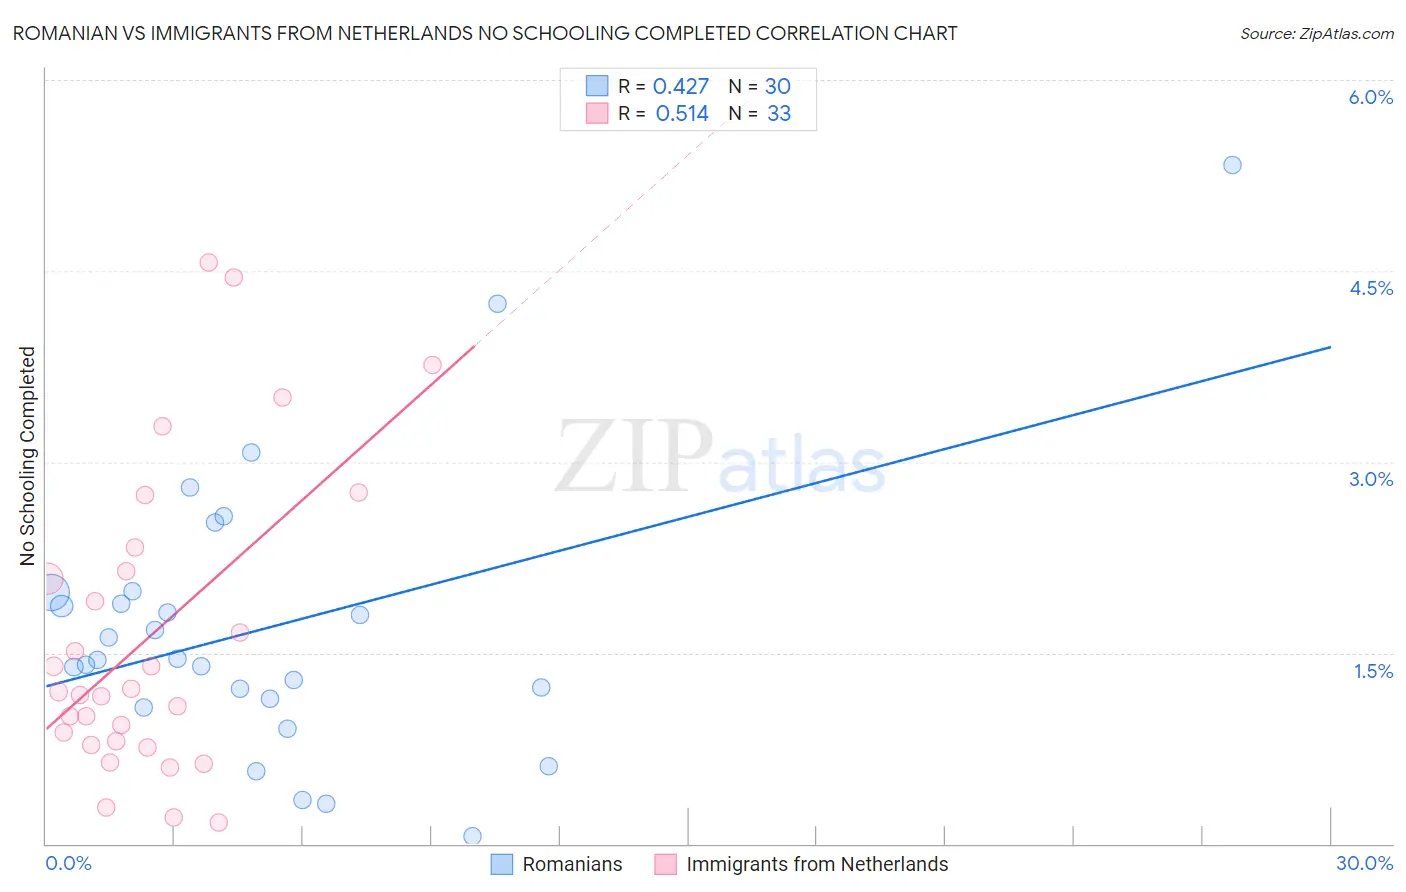
Romanian vs Immigrants from Netherlands No Schooling Completed Correlation Chart
The statistical analysis conducted on geographies consisting of 373,712,134 people shows a moderate positive correlation between the proportion of Romanians and percentage of population with no schooling in the United States with a correlation coefficient (R) of 0.427 and weighted average of 1.8%. Similarly, the statistical analysis conducted on geographies consisting of 236,079,669 people shows a substantial positive correlation between the proportion of Immigrants from Netherlands and percentage of population with no schooling in the United States with a correlation coefficient (R) of 0.514 and weighted average of 1.7%, a difference of 4.1%.
No Schooling Completed Correlation Summary
| Measurement | Romanian | Immigrants from Netherlands |
| Minimum | 0.062% | 0.16% |
| Maximum | 5.3% | 4.6% |
| Range | 5.3% | 4.4% |
| Mean | 1.7% | 1.6% |
| Median | 1.4% | 1.2% |
| Interquartile 25% (IQ1) | 1.1% | 0.79% |
| Interquartile 75% (IQ3) | 2.0% | 2.2% |
| Interquartile Range (IQR) | 0.83% | 1.4% |
| Standard Deviation (Sample) | 1.1% | 1.2% |
| Standard Deviation (Population) | 1.1% | 1.2% |
Similar Demographics by No Schooling Completed
Demographics Similar to Romanians by No Schooling Completed
In terms of no schooling completed, the demographic groups most similar to Romanians are Turkish (1.8%, a difference of 0.37%), Immigrants from Germany (1.8%, a difference of 0.52%), Sioux (1.8%, a difference of 0.62%), Nonimmigrants (1.8%, a difference of 0.87%), and Puget Sound Salish (1.8%, a difference of 0.88%).
| Demographics | Rating | Rank | No Schooling Completed |
| Immigrants | Australia | 99.2 /100 | #85 | Exceptional 1.7% |
| Ukrainians | 99.2 /100 | #86 | Exceptional 1.8% |
| Osage | 99.2 /100 | #87 | Exceptional 1.8% |
| Immigrants | Western Europe | 99.2 /100 | #88 | Exceptional 1.8% |
| South Africans | 99.1 /100 | #89 | Exceptional 1.8% |
| Sioux | 99.0 /100 | #90 | Exceptional 1.8% |
| Immigrants | Germany | 99.0 /100 | #91 | Exceptional 1.8% |
| Romanians | 98.8 /100 | #92 | Exceptional 1.8% |
| Turks | 98.7 /100 | #93 | Exceptional 1.8% |
| Immigrants | Nonimmigrants | 98.5 /100 | #94 | Exceptional 1.8% |
| Puget Sound Salish | 98.5 /100 | #95 | Exceptional 1.8% |
| Bhutanese | 98.4 /100 | #96 | Exceptional 1.8% |
| Immigrants | Ireland | 98.4 /100 | #97 | Exceptional 1.8% |
| Iranians | 98.2 /100 | #98 | Exceptional 1.8% |
| Choctaw | 98.1 /100 | #99 | Exceptional 1.8% |
Demographics Similar to Immigrants from Netherlands by No Schooling Completed
In terms of no schooling completed, the demographic groups most similar to Immigrants from Netherlands are Immigrants from England (1.7%, a difference of 0.34%), Cajun (1.7%, a difference of 0.51%), Chickasaw (1.7%, a difference of 0.97%), Immigrants from India (1.7%, a difference of 1.0%), and Zimbabwean (1.7%, a difference of 1.0%).
| Demographics | Rating | Rank | No Schooling Completed |
| Russians | 99.8 /100 | #63 | Exceptional 1.7% |
| New Zealanders | 99.7 /100 | #64 | Exceptional 1.7% |
| Serbians | 99.7 /100 | #65 | Exceptional 1.7% |
| Canadians | 99.7 /100 | #66 | Exceptional 1.7% |
| Immigrants | Austria | 99.7 /100 | #67 | Exceptional 1.7% |
| Immigrants | Lithuania | 99.7 /100 | #68 | Exceptional 1.7% |
| Chickasaw | 99.6 /100 | #69 | Exceptional 1.7% |
| Immigrants | Netherlands | 99.6 /100 | #70 | Exceptional 1.7% |
| Immigrants | England | 99.5 /100 | #71 | Exceptional 1.7% |
| Cajuns | 99.5 /100 | #72 | Exceptional 1.7% |
| Immigrants | India | 99.4 /100 | #73 | Exceptional 1.7% |
| Zimbabweans | 99.4 /100 | #74 | Exceptional 1.7% |
| Immigrants | Belgium | 99.3 /100 | #75 | Exceptional 1.7% |
| Cherokee | 99.3 /100 | #76 | Exceptional 1.7% |
| Immigrants | Sweden | 99.3 /100 | #77 | Exceptional 1.7% |