Lithuanian vs Immigrants from Italy 8th Grade
COMPARE
Lithuanian
Immigrants from Italy
8th Grade
8th Grade Comparison
Lithuanians
Immigrants from Italy
97.3%
8TH GRADE
100.0/ 100
METRIC RATING
18th/ 347
METRIC RANK
95.8%
8TH GRADE
63.5/ 100
METRIC RATING
164th/ 347
METRIC RANK
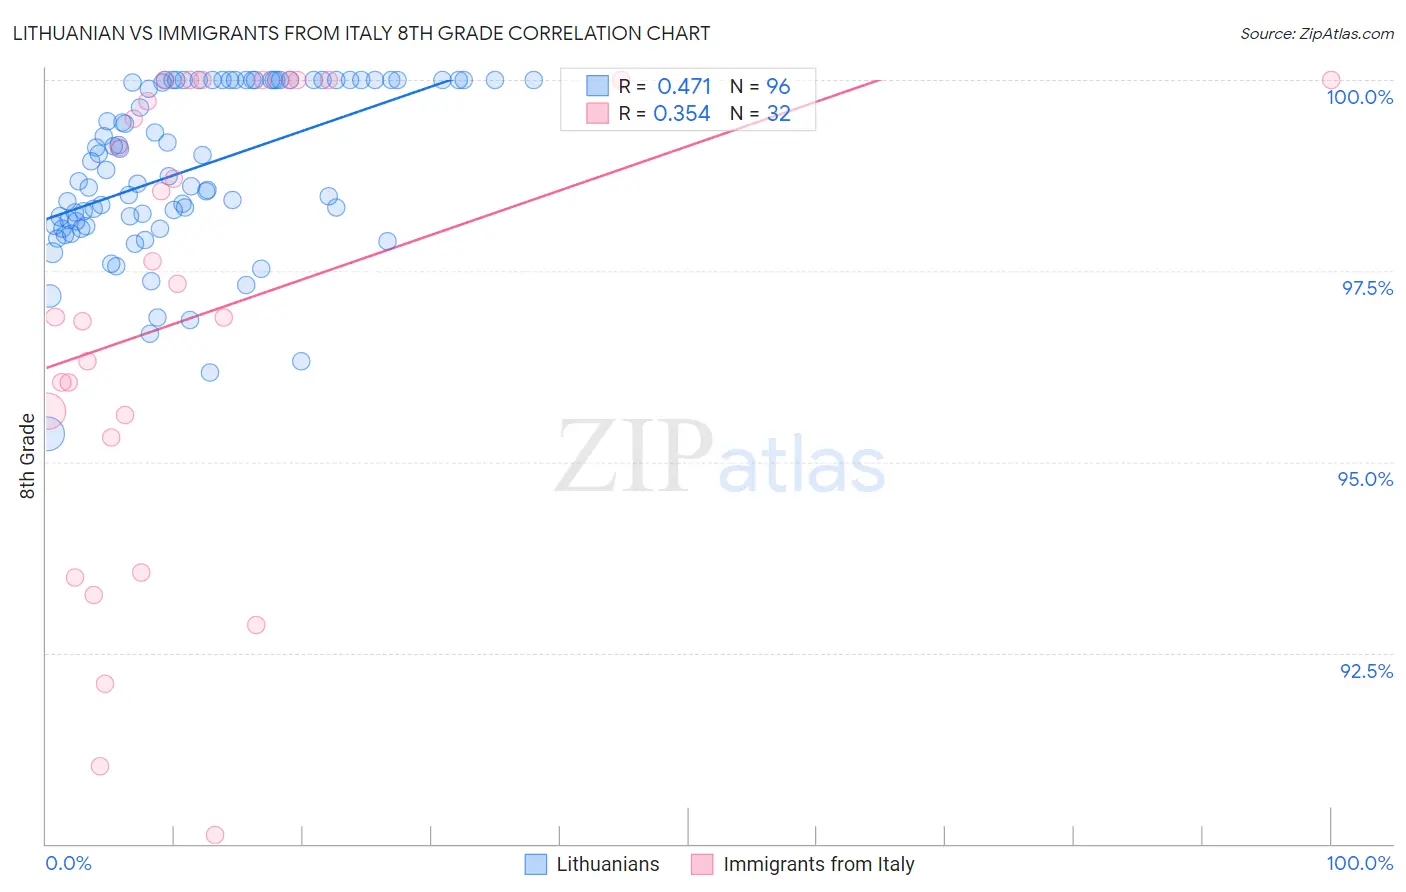
Lithuanian vs Immigrants from Italy 8th Grade Correlation Chart
The statistical analysis conducted on geographies consisting of 421,948,041 people shows a moderate positive correlation between the proportion of Lithuanians and percentage of population with at least 8th grade education in the United States with a correlation coefficient (R) of 0.471 and weighted average of 97.3%. Similarly, the statistical analysis conducted on geographies consisting of 324,226,009 people shows a mild positive correlation between the proportion of Immigrants from Italy and percentage of population with at least 8th grade education in the United States with a correlation coefficient (R) of 0.354 and weighted average of 95.8%, a difference of 1.5%.
8th Grade Correlation Summary
| Measurement | Lithuanian | Immigrants from Italy |
| Minimum | 95.4% | 90.1% |
| Maximum | 100.0% | 100.0% |
| Range | 4.6% | 9.9% |
| Mean | 98.8% | 97.0% |
| Median | 98.8% | 97.1% |
| Interquartile 25% (IQ1) | 98.1% | 95.5% |
| Interquartile 75% (IQ3) | 100.0% | 100.0% |
| Interquartile Range (IQR) | 1.9% | 4.5% |
| Standard Deviation (Sample) | 1.1% | 3.0% |
| Standard Deviation (Population) | 1.1% | 2.9% |
Similar Demographics by 8th Grade
Demographics Similar to Lithuanians by 8th Grade
In terms of 8th grade, the demographic groups most similar to Lithuanians are Irish (97.3%, a difference of 0.010%), Scottish (97.3%, a difference of 0.010%), Tlingit-Haida (97.3%, a difference of 0.020%), Pennsylvania German (97.3%, a difference of 0.050%), and Alaskan Athabascan (97.3%, a difference of 0.060%).
| Demographics | Rating | Rank | 8th Grade |
| Poles | 100.0 /100 | #11 | Exceptional 97.4% |
| Swedes | 100.0 /100 | #12 | Exceptional 97.4% |
| Alaskan Athabascans | 100.0 /100 | #13 | Exceptional 97.3% |
| English | 100.0 /100 | #14 | Exceptional 97.3% |
| Pennsylvania Germans | 100.0 /100 | #15 | Exceptional 97.3% |
| Tlingit-Haida | 100.0 /100 | #16 | Exceptional 97.3% |
| Irish | 100.0 /100 | #17 | Exceptional 97.3% |
| Lithuanians | 100.0 /100 | #18 | Exceptional 97.3% |
| Scottish | 100.0 /100 | #19 | Exceptional 97.3% |
| Croatians | 100.0 /100 | #20 | Exceptional 97.2% |
| Danes | 100.0 /100 | #21 | Exceptional 97.2% |
| Welsh | 100.0 /100 | #22 | Exceptional 97.2% |
| French Canadians | 100.0 /100 | #23 | Exceptional 97.2% |
| Scandinavians | 100.0 /100 | #24 | Exceptional 97.2% |
| Czechs | 100.0 /100 | #25 | Exceptional 97.1% |
Demographics Similar to Immigrants from Italy by 8th Grade
In terms of 8th grade, the demographic groups most similar to Immigrants from Italy are Immigrants from Sri Lanka (95.8%, a difference of 0.0%), Alsatian (95.8%, a difference of 0.010%), Immigrants from Poland (95.8%, a difference of 0.020%), Spaniard (95.8%, a difference of 0.020%), and Seminole (95.8%, a difference of 0.030%).
| Demographics | Rating | Rank | 8th Grade |
| Immigrants | Taiwan | 70.5 /100 | #157 | Good 95.9% |
| Arabs | 69.4 /100 | #158 | Good 95.9% |
| Immigrants | Kazakhstan | 68.4 /100 | #159 | Good 95.9% |
| Seminole | 67.7 /100 | #160 | Good 95.8% |
| Bermudans | 67.5 /100 | #161 | Good 95.8% |
| Immigrants | Kenya | 67.2 /100 | #162 | Good 95.8% |
| Immigrants | Sri Lanka | 64.1 /100 | #163 | Good 95.8% |
| Immigrants | Italy | 63.5 /100 | #164 | Good 95.8% |
| Alsatians | 61.4 /100 | #165 | Good 95.8% |
| Immigrants | Poland | 61.1 /100 | #166 | Good 95.8% |
| Spaniards | 60.0 /100 | #167 | Good 95.8% |
| Immigrants | Ukraine | 59.5 /100 | #168 | Average 95.8% |
| Immigrants | Iran | 58.6 /100 | #169 | Average 95.8% |
| Ute | 58.5 /100 | #170 | Average 95.8% |
| Egyptians | 58.2 /100 | #171 | Average 95.8% |