Immigrants from Eastern Africa vs Immigrants from Italy No Schooling Completed
COMPARE
Immigrants from Eastern Africa
Immigrants from Italy
No Schooling Completed
No Schooling Completed Comparison
Immigrants from Eastern Africa
Immigrants from Italy
2.4%
NO SCHOOLING COMPLETED
0.9/ 100
METRIC RATING
254th/ 347
METRIC RANK
2.0%
NO SCHOOLING COMPLETED
68.9/ 100
METRIC RATING
153rd/ 347
METRIC RANK
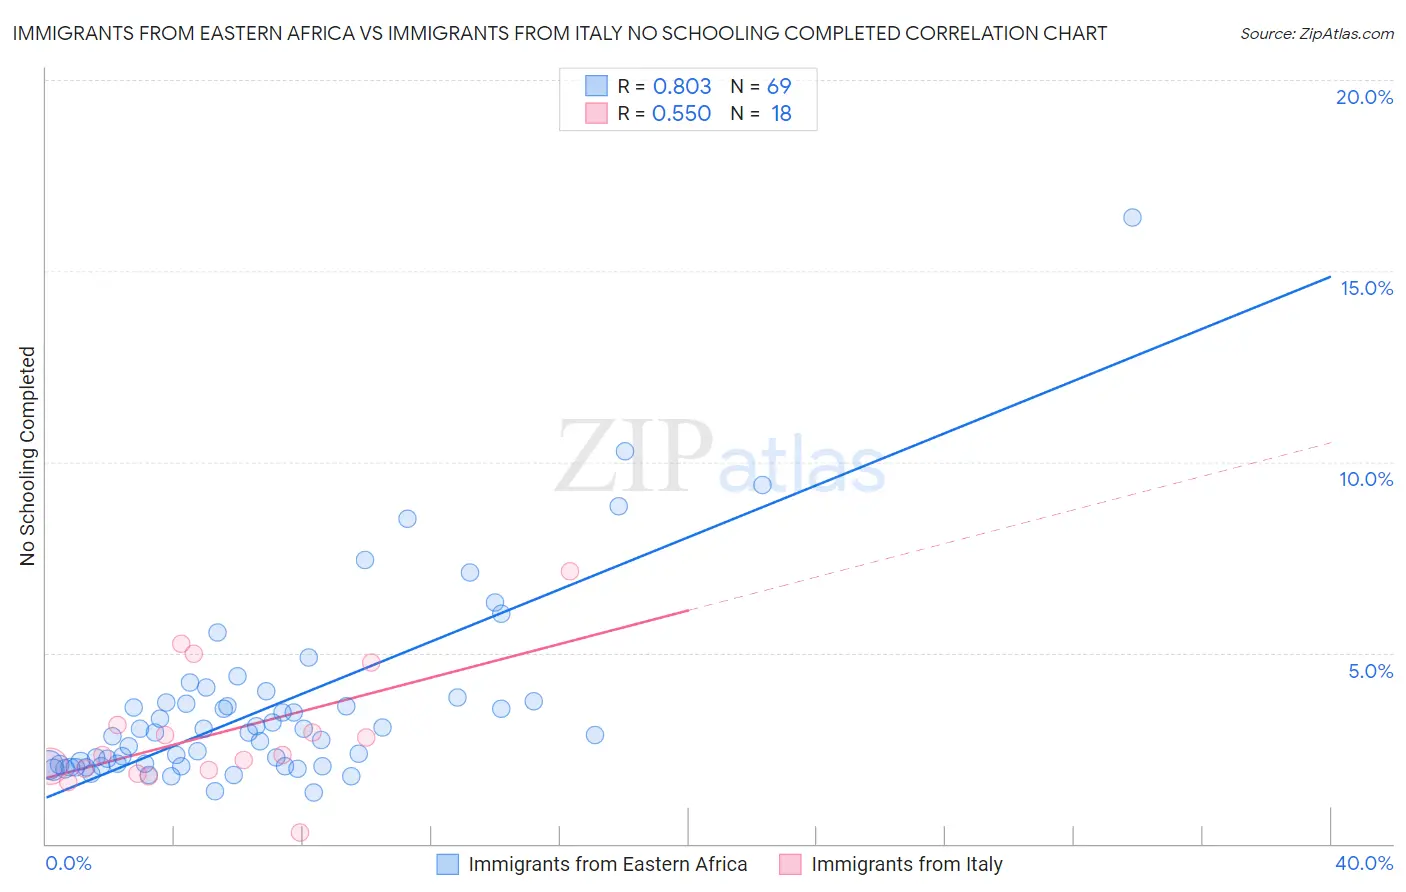
Immigrants from Eastern Africa vs Immigrants from Italy No Schooling Completed Correlation Chart
The statistical analysis conducted on geographies consisting of 352,335,955 people shows a very strong positive correlation between the proportion of Immigrants from Eastern Africa and percentage of population with no schooling in the United States with a correlation coefficient (R) of 0.803 and weighted average of 2.4%. Similarly, the statistical analysis conducted on geographies consisting of 321,356,663 people shows a substantial positive correlation between the proportion of Immigrants from Italy and percentage of population with no schooling in the United States with a correlation coefficient (R) of 0.550 and weighted average of 2.0%, a difference of 19.0%.
No Schooling Completed Correlation Summary
| Measurement | Immigrants from Eastern Africa | Immigrants from Italy |
| Minimum | 1.4% | 0.28% |
| Maximum | 16.4% | 7.1% |
| Range | 15.1% | 6.9% |
| Mean | 3.6% | 2.9% |
| Median | 2.9% | 2.3% |
| Interquartile 25% (IQ1) | 2.0% | 1.9% |
| Interquartile 75% (IQ3) | 3.7% | 3.1% |
| Interquartile Range (IQR) | 1.7% | 1.2% |
| Standard Deviation (Sample) | 2.5% | 1.6% |
| Standard Deviation (Population) | 2.5% | 1.6% |
Similar Demographics by No Schooling Completed
Demographics Similar to Immigrants from Eastern Africa by No Schooling Completed
In terms of no schooling completed, the demographic groups most similar to Immigrants from Eastern Africa are Immigrants from Asia (2.4%, a difference of 0.13%), Ethiopian (2.4%, a difference of 0.20%), Immigrants from Colombia (2.4%, a difference of 0.25%), Yaqui (2.4%, a difference of 0.37%), and Immigrants from Africa (2.4%, a difference of 0.70%).
| Demographics | Rating | Rank | No Schooling Completed |
| Immigrants | Iraq | 1.3 /100 | #247 | Tragic 2.4% |
| Asians | 1.2 /100 | #248 | Tragic 2.4% |
| Jamaicans | 1.2 /100 | #249 | Tragic 2.4% |
| Immigrants | Middle Africa | 1.1 /100 | #250 | Tragic 2.4% |
| Immigrants | Africa | 1.1 /100 | #251 | Tragic 2.4% |
| Immigrants | Colombia | 1.0 /100 | #252 | Tragic 2.4% |
| Immigrants | Asia | 0.9 /100 | #253 | Tragic 2.4% |
| Immigrants | Eastern Africa | 0.9 /100 | #254 | Tragic 2.4% |
| Ethiopians | 0.8 /100 | #255 | Tragic 2.4% |
| Yaqui | 0.8 /100 | #256 | Tragic 2.4% |
| Immigrants | South America | 0.6 /100 | #257 | Tragic 2.5% |
| Assyrians/Chaldeans/Syriacs | 0.6 /100 | #258 | Tragic 2.5% |
| Immigrants | Jamaica | 0.6 /100 | #259 | Tragic 2.5% |
| Immigrants | Ethiopia | 0.6 /100 | #260 | Tragic 2.5% |
| Armenians | 0.5 /100 | #261 | Tragic 2.5% |
Demographics Similar to Immigrants from Italy by No Schooling Completed
In terms of no schooling completed, the demographic groups most similar to Immigrants from Italy are Immigrants from Venezuela (2.0%, a difference of 0.060%), Immigrants from Russia (2.0%, a difference of 0.20%), Immigrants from Eastern Europe (2.0%, a difference of 0.24%), Chilean (2.0%, a difference of 0.27%), and Immigrants from Sri Lanka (2.0%, a difference of 0.30%).
| Demographics | Rating | Rank | No Schooling Completed |
| Immigrants | Moldova | 78.0 /100 | #146 | Good 2.0% |
| Soviet Union | 77.1 /100 | #147 | Good 2.0% |
| Shoshone | 76.7 /100 | #148 | Good 2.0% |
| Immigrants | North Macedonia | 75.9 /100 | #149 | Good 2.0% |
| Blackfeet | 72.9 /100 | #150 | Good 2.0% |
| Immigrants | Jordan | 70.9 /100 | #151 | Good 2.0% |
| Immigrants | Eastern Europe | 70.4 /100 | #152 | Good 2.0% |
| Immigrants | Italy | 68.9 /100 | #153 | Good 2.0% |
| Immigrants | Venezuela | 68.5 /100 | #154 | Good 2.0% |
| Immigrants | Russia | 67.6 /100 | #155 | Good 2.0% |
| Chileans | 67.2 /100 | #156 | Good 2.0% |
| Immigrants | Sri Lanka | 67.0 /100 | #157 | Good 2.0% |
| Immigrants | Korea | 66.7 /100 | #158 | Good 2.0% |
| Immigrants | Spain | 66.4 /100 | #159 | Good 2.0% |
| Kenyans | 65.7 /100 | #160 | Good 2.0% |