Immigrants from Fiji vs Honduran No Schooling Completed
COMPARE
Immigrants from Fiji
Honduran
No Schooling Completed
No Schooling Completed Comparison
Immigrants from Fiji
Hondurans
3.5%
NO SCHOOLING COMPLETED
0.0/ 100
METRIC RATING
336th/ 347
METRIC RANK
3.1%
NO SCHOOLING COMPLETED
0.0/ 100
METRIC RATING
313th/ 347
METRIC RANK
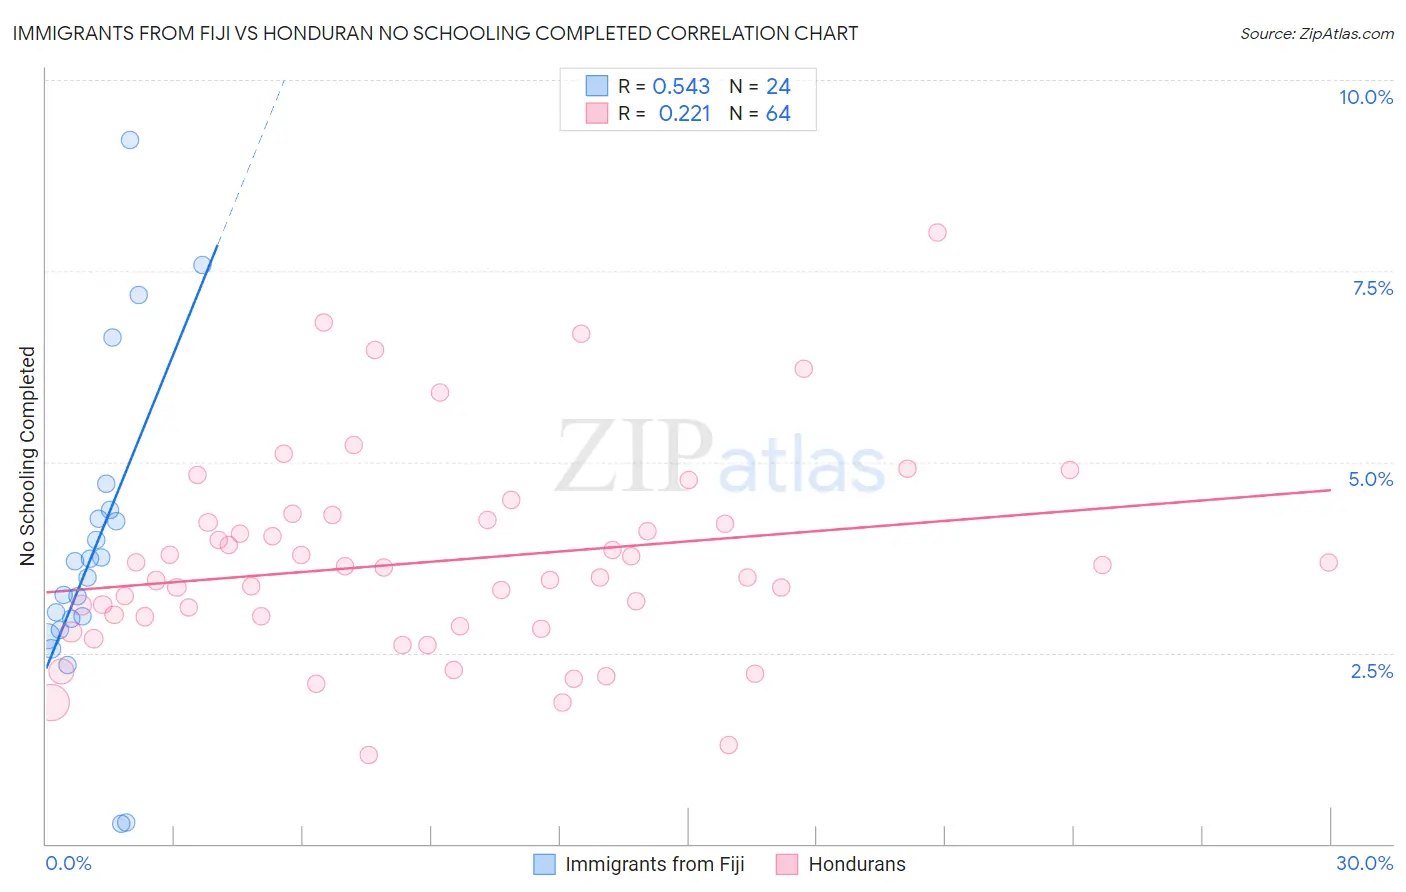
Immigrants from Fiji vs Honduran No Schooling Completed Correlation Chart
The statistical analysis conducted on geographies consisting of 93,588,914 people shows a substantial positive correlation between the proportion of Immigrants from Fiji and percentage of population with no schooling in the United States with a correlation coefficient (R) of 0.543 and weighted average of 3.5%. Similarly, the statistical analysis conducted on geographies consisting of 355,822,203 people shows a weak positive correlation between the proportion of Hondurans and percentage of population with no schooling in the United States with a correlation coefficient (R) of 0.221 and weighted average of 3.1%, a difference of 14.5%.
No Schooling Completed Correlation Summary
| Measurement | Immigrants from Fiji | Honduran |
| Minimum | 0.26% | 1.2% |
| Maximum | 9.2% | 8.0% |
| Range | 9.0% | 6.8% |
| Mean | 3.9% | 3.7% |
| Median | 3.6% | 3.6% |
| Interquartile 25% (IQ1) | 2.9% | 2.9% |
| Interquartile 75% (IQ3) | 4.3% | 4.2% |
| Interquartile Range (IQR) | 1.4% | 1.3% |
| Standard Deviation (Sample) | 2.1% | 1.3% |
| Standard Deviation (Population) | 2.0% | 1.3% |
Similar Demographics by No Schooling Completed
Demographics Similar to Immigrants from Fiji by No Schooling Completed
In terms of no schooling completed, the demographic groups most similar to Immigrants from Fiji are Immigrants from Cambodia (3.5%, a difference of 0.37%), Immigrants from Cabo Verde (3.5%, a difference of 0.71%), Bangladeshi (3.5%, a difference of 0.95%), Yakama (3.6%, a difference of 1.3%), and Guatemalan (3.5%, a difference of 1.4%).
| Demographics | Rating | Rank | No Schooling Completed |
| Immigrants | Vietnam | 0.0 /100 | #329 | Tragic 3.3% |
| Immigrants | Armenia | 0.0 /100 | #330 | Tragic 3.3% |
| Japanese | 0.0 /100 | #331 | Tragic 3.3% |
| Central Americans | 0.0 /100 | #332 | Tragic 3.4% |
| Immigrants | Dominican Republic | 0.0 /100 | #333 | Tragic 3.4% |
| Guatemalans | 0.0 /100 | #334 | Tragic 3.5% |
| Immigrants | Cambodia | 0.0 /100 | #335 | Tragic 3.5% |
| Immigrants | Fiji | 0.0 /100 | #336 | Tragic 3.5% |
| Immigrants | Cabo Verde | 0.0 /100 | #337 | Tragic 3.5% |
| Bangladeshis | 0.0 /100 | #338 | Tragic 3.5% |
| Yakama | 0.0 /100 | #339 | Tragic 3.6% |
| Immigrants | Guatemala | 0.0 /100 | #340 | Tragic 3.6% |
| Immigrants | Central America | 0.0 /100 | #341 | Tragic 3.6% |
| Immigrants | Mexico | 0.0 /100 | #342 | Tragic 3.6% |
| Salvadorans | 0.0 /100 | #343 | Tragic 3.7% |
Demographics Similar to Hondurans by No Schooling Completed
In terms of no schooling completed, the demographic groups most similar to Hondurans are Immigrants from Belize (3.1%, a difference of 0.090%), Immigrants from Nicaragua (3.1%, a difference of 0.33%), Sri Lankan (3.0%, a difference of 0.51%), Immigrants from Ecuador (3.1%, a difference of 0.69%), and Immigrants from the Azores (3.0%, a difference of 0.79%).
| Demographics | Rating | Rank | No Schooling Completed |
| Belizeans | 0.0 /100 | #306 | Tragic 3.0% |
| Immigrants | Haiti | 0.0 /100 | #307 | Tragic 3.0% |
| Immigrants | Somalia | 0.0 /100 | #308 | Tragic 3.0% |
| Hispanics or Latinos | 0.0 /100 | #309 | Tragic 3.0% |
| Guyanese | 0.0 /100 | #310 | Tragic 3.0% |
| Immigrants | Azores | 0.0 /100 | #311 | Tragic 3.0% |
| Sri Lankans | 0.0 /100 | #312 | Tragic 3.0% |
| Hondurans | 0.0 /100 | #313 | Tragic 3.1% |
| Immigrants | Belize | 0.0 /100 | #314 | Tragic 3.1% |
| Immigrants | Nicaragua | 0.0 /100 | #315 | Tragic 3.1% |
| Immigrants | Ecuador | 0.0 /100 | #316 | Tragic 3.1% |
| Cape Verdeans | 0.0 /100 | #317 | Tragic 3.1% |
| Immigrants | Guyana | 0.0 /100 | #318 | Tragic 3.1% |
| Immigrants | Burma/Myanmar | 0.0 /100 | #319 | Tragic 3.1% |
| Immigrants | Bangladesh | 0.0 /100 | #320 | Tragic 3.1% |