Houma vs Honduran No Schooling Completed
COMPARE
Houma
Honduran
No Schooling Completed
No Schooling Completed Comparison
Houma
Hondurans
2.8%
NO SCHOOLING COMPLETED
0.0/ 100
METRIC RATING
295th/ 347
METRIC RANK
3.1%
NO SCHOOLING COMPLETED
0.0/ 100
METRIC RATING
313th/ 347
METRIC RANK
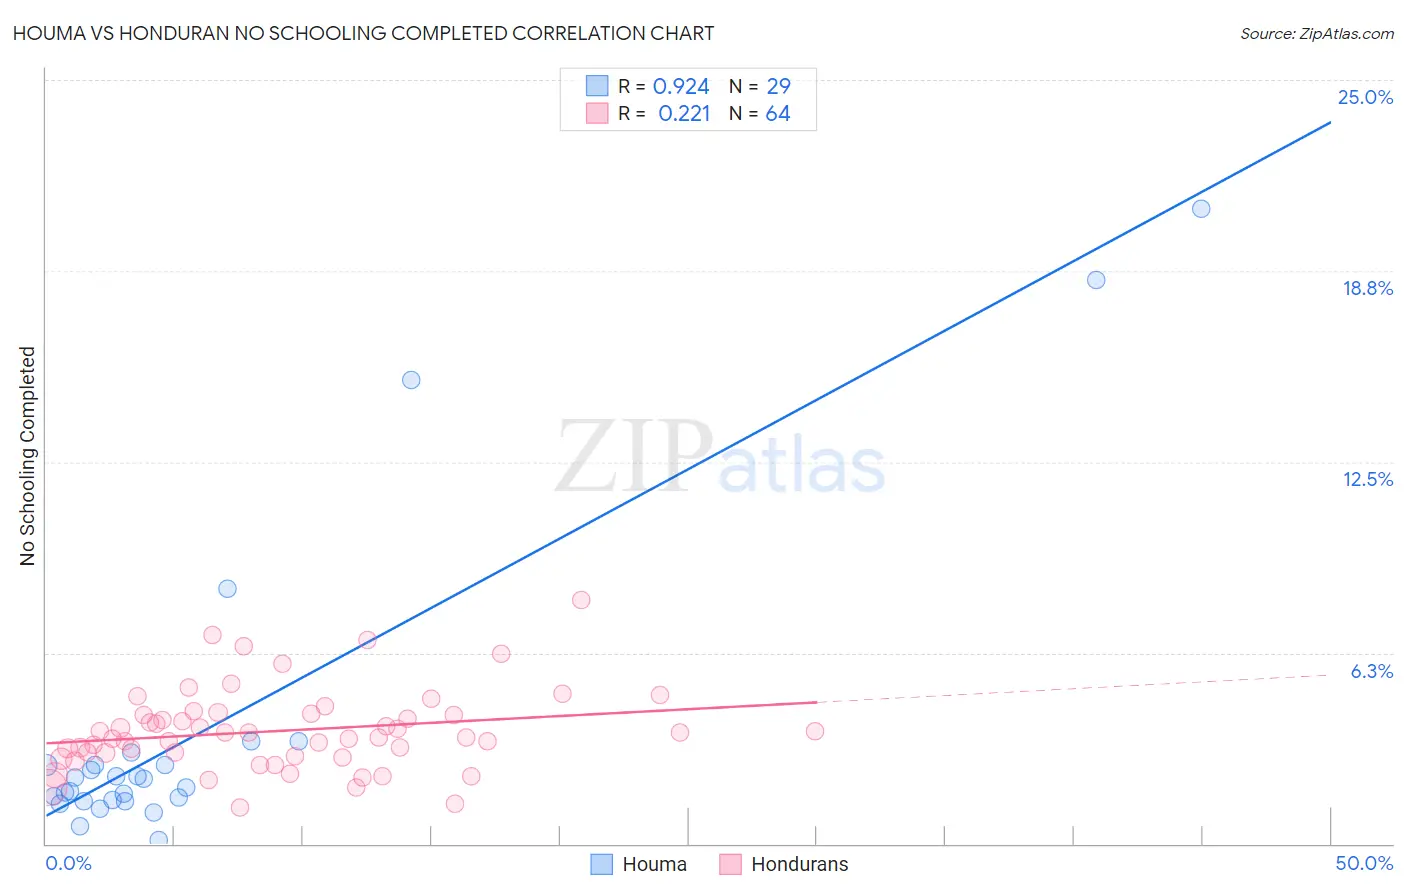
Houma vs Honduran No Schooling Completed Correlation Chart
The statistical analysis conducted on geographies consisting of 36,712,306 people shows a near-perfect positive correlation between the proportion of Houma and percentage of population with no schooling in the United States with a correlation coefficient (R) of 0.924 and weighted average of 2.8%. Similarly, the statistical analysis conducted on geographies consisting of 355,822,203 people shows a weak positive correlation between the proportion of Hondurans and percentage of population with no schooling in the United States with a correlation coefficient (R) of 0.221 and weighted average of 3.1%, a difference of 10.0%.
No Schooling Completed Correlation Summary
| Measurement | Houma | Honduran |
| Minimum | 0.12% | 1.2% |
| Maximum | 20.8% | 8.0% |
| Range | 20.7% | 6.8% |
| Mean | 3.8% | 3.7% |
| Median | 2.1% | 3.6% |
| Interquartile 25% (IQ1) | 1.4% | 2.9% |
| Interquartile 75% (IQ3) | 2.8% | 4.2% |
| Interquartile Range (IQR) | 1.4% | 1.3% |
| Standard Deviation (Sample) | 5.2% | 1.3% |
| Standard Deviation (Population) | 5.1% | 1.3% |
Demographics Similar to Houma and Hondurans by No Schooling Completed
In terms of no schooling completed, the demographic groups most similar to Houma are Immigrants (2.8%, a difference of 0.10%), Immigrants from Eritrea (2.8%, a difference of 0.52%), Immigrants from Cuba (2.8%, a difference of 1.3%), Immigrants from Dominica (2.8%, a difference of 1.6%), and Central American Indian (2.8%, a difference of 2.1%). Similarly, the demographic groups most similar to Hondurans are Immigrants from Belize (3.1%, a difference of 0.090%), Sri Lankan (3.0%, a difference of 0.51%), Immigrants from the Azores (3.0%, a difference of 0.79%), Guyanese (3.0%, a difference of 0.89%), and Hispanic or Latino (3.0%, a difference of 0.94%).
| Demographics | Rating | Rank | No Schooling Completed |
| Immigrants | Eritrea | 0.0 /100 | #294 | Tragic 2.8% |
| Houma | 0.0 /100 | #295 | Tragic 2.8% |
| Immigrants | Immigrants | 0.0 /100 | #296 | Tragic 2.8% |
| Immigrants | Cuba | 0.0 /100 | #297 | Tragic 2.8% |
| Immigrants | Dominica | 0.0 /100 | #298 | Tragic 2.8% |
| Central American Indians | 0.0 /100 | #299 | Tragic 2.8% |
| Haitians | 0.0 /100 | #300 | Tragic 2.9% |
| Immigrants | South Eastern Asia | 0.0 /100 | #301 | Tragic 2.9% |
| Immigrants | Caribbean | 0.0 /100 | #302 | Tragic 2.9% |
| Somalis | 0.0 /100 | #303 | Tragic 2.9% |
| Nicaraguans | 0.0 /100 | #304 | Tragic 2.9% |
| Ecuadorians | 0.0 /100 | #305 | Tragic 3.0% |
| Belizeans | 0.0 /100 | #306 | Tragic 3.0% |
| Immigrants | Haiti | 0.0 /100 | #307 | Tragic 3.0% |
| Immigrants | Somalia | 0.0 /100 | #308 | Tragic 3.0% |
| Hispanics or Latinos | 0.0 /100 | #309 | Tragic 3.0% |
| Guyanese | 0.0 /100 | #310 | Tragic 3.0% |
| Immigrants | Azores | 0.0 /100 | #311 | Tragic 3.0% |
| Sri Lankans | 0.0 /100 | #312 | Tragic 3.0% |
| Hondurans | 0.0 /100 | #313 | Tragic 3.1% |
| Immigrants | Belize | 0.0 /100 | #314 | Tragic 3.1% |