Immigrants from Haiti vs Cree 8th Grade
COMPARE
Immigrants from Haiti
Cree
8th Grade
8th Grade Comparison
Immigrants from Haiti
Cree
93.9%
8TH GRADE
0.0/ 100
METRIC RATING
305th/ 347
METRIC RANK
96.4%
8TH GRADE
98.6/ 100
METRIC RATING
99th/ 347
METRIC RANK
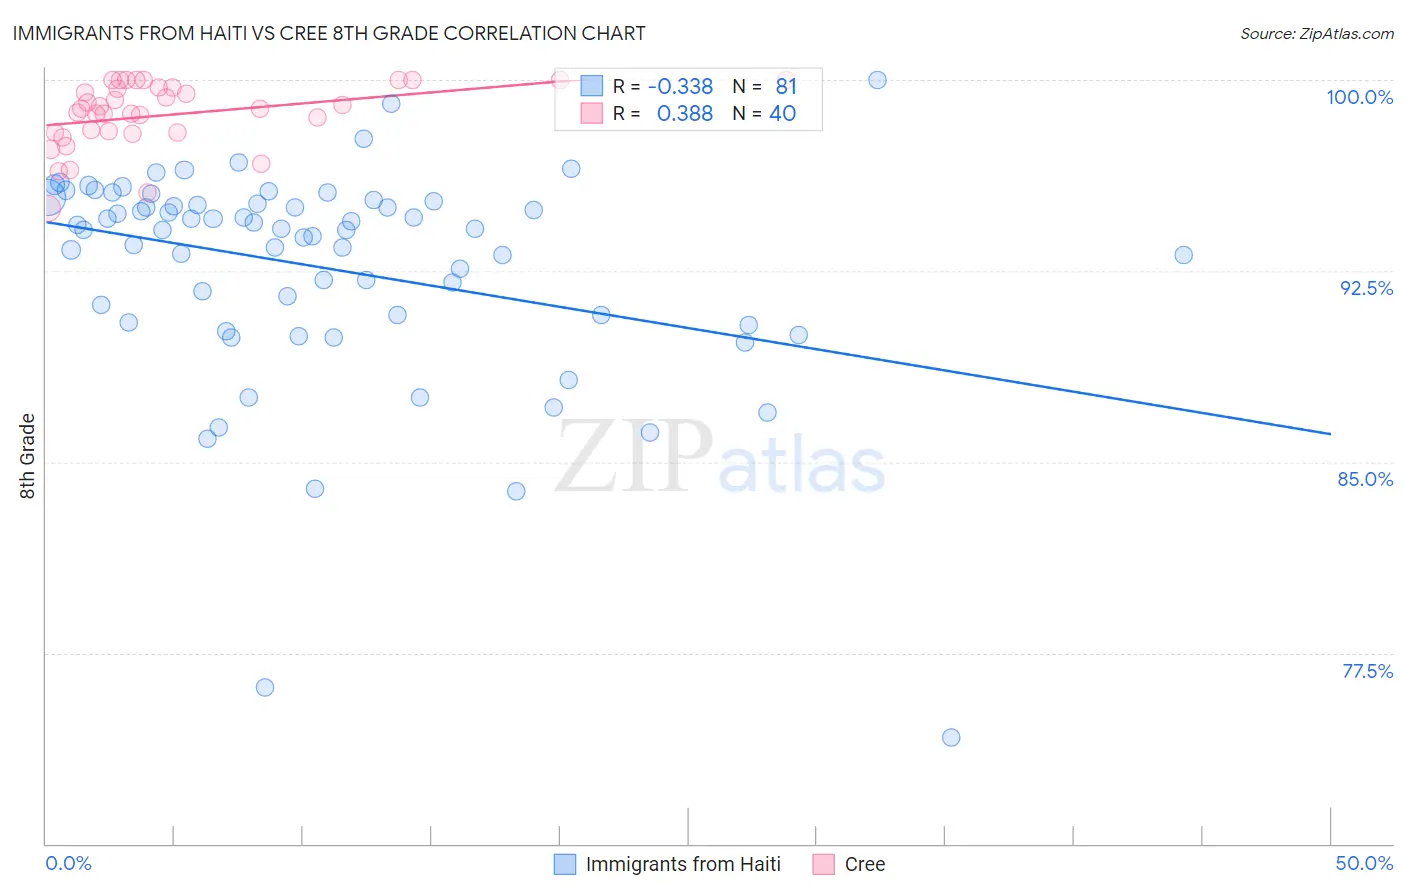
Immigrants from Haiti vs Cree 8th Grade Correlation Chart
The statistical analysis conducted on geographies consisting of 225,286,322 people shows a mild negative correlation between the proportion of Immigrants from Haiti and percentage of population with at least 8th grade education in the United States with a correlation coefficient (R) of -0.338 and weighted average of 93.9%. Similarly, the statistical analysis conducted on geographies consisting of 76,204,399 people shows a mild positive correlation between the proportion of Cree and percentage of population with at least 8th grade education in the United States with a correlation coefficient (R) of 0.388 and weighted average of 96.4%, a difference of 2.7%.
8th Grade Correlation Summary
| Measurement | Immigrants from Haiti | Cree |
| Minimum | 74.2% | 94.9% |
| Maximum | 100.0% | 100.0% |
| Range | 25.8% | 5.1% |
| Mean | 92.6% | 98.6% |
| Median | 94.1% | 98.9% |
| Interquartile 25% (IQ1) | 90.6% | 97.9% |
| Interquartile 75% (IQ3) | 95.2% | 99.7% |
| Interquartile Range (IQR) | 4.6% | 1.8% |
| Standard Deviation (Sample) | 4.3% | 1.3% |
| Standard Deviation (Population) | 4.3% | 1.3% |
Similar Demographics by 8th Grade
Demographics Similar to Immigrants from Haiti by 8th Grade
In terms of 8th grade, the demographic groups most similar to Immigrants from Haiti are Guyanese (93.9%, a difference of 0.030%), Immigrants from Guyana (93.8%, a difference of 0.090%), Immigrants from Portugal (93.8%, a difference of 0.11%), Immigrants from Dominica (94.0%, a difference of 0.12%), and Sri Lankan (94.0%, a difference of 0.16%).
| Demographics | Rating | Rank | 8th Grade |
| Indonesians | 0.0 /100 | #298 | Tragic 94.1% |
| Cubans | 0.0 /100 | #299 | Tragic 94.1% |
| Immigrants | Burma/Myanmar | 0.0 /100 | #300 | Tragic 94.1% |
| Immigrants | Laos | 0.0 /100 | #301 | Tragic 94.1% |
| Sri Lankans | 0.0 /100 | #302 | Tragic 94.0% |
| Immigrants | Dominica | 0.0 /100 | #303 | Tragic 94.0% |
| Guyanese | 0.0 /100 | #304 | Tragic 93.9% |
| Immigrants | Haiti | 0.0 /100 | #305 | Tragic 93.9% |
| Immigrants | Guyana | 0.0 /100 | #306 | Tragic 93.8% |
| Immigrants | Portugal | 0.0 /100 | #307 | Tragic 93.8% |
| Ecuadorians | 0.0 /100 | #308 | Tragic 93.6% |
| Immigrants | Immigrants | 0.0 /100 | #309 | Tragic 93.6% |
| Japanese | 0.0 /100 | #310 | Tragic 93.6% |
| Immigrants | Bangladesh | 0.0 /100 | #311 | Tragic 93.6% |
| Cape Verdeans | 0.0 /100 | #312 | Tragic 93.5% |
Demographics Similar to Cree by 8th Grade
In terms of 8th grade, the demographic groups most similar to Cree are Osage (96.4%, a difference of 0.0%), Immigrants from Germany (96.4%, a difference of 0.0%), Potawatomi (96.4%, a difference of 0.010%), Immigrants from Czechoslovakia (96.4%, a difference of 0.010%), and Immigrants from Singapore (96.4%, a difference of 0.020%).
| Demographics | Rating | Rank | 8th Grade |
| Menominee | 98.9 /100 | #92 | Exceptional 96.4% |
| Immigrants | Denmark | 98.8 /100 | #93 | Exceptional 96.4% |
| Immigrants | Singapore | 98.8 /100 | #94 | Exceptional 96.4% |
| German Russians | 98.8 /100 | #95 | Exceptional 96.4% |
| Potawatomi | 98.7 /100 | #96 | Exceptional 96.4% |
| Osage | 98.7 /100 | #97 | Exceptional 96.4% |
| Immigrants | Germany | 98.7 /100 | #98 | Exceptional 96.4% |
| Cree | 98.6 /100 | #99 | Exceptional 96.4% |
| Immigrants | Czechoslovakia | 98.6 /100 | #100 | Exceptional 96.4% |
| Bhutanese | 98.2 /100 | #101 | Exceptional 96.4% |
| South Africans | 98.2 /100 | #102 | Exceptional 96.4% |
| Immigrants | Saudi Arabia | 98.0 /100 | #103 | Exceptional 96.3% |
| Kiowa | 98.0 /100 | #104 | Exceptional 96.3% |
| Immigrants | North Macedonia | 98.0 /100 | #105 | Exceptional 96.3% |
| Okinawans | 98.0 /100 | #106 | Exceptional 96.3% |