Lithuanian vs Spanish 8th Grade
COMPARE
Lithuanian
Spanish
8th Grade
8th Grade Comparison
Lithuanians
Spanish
97.3%
8TH GRADE
100.0/ 100
METRIC RATING
18th/ 347
METRIC RANK
96.0%
8TH GRADE
85.1/ 100
METRIC RATING
143rd/ 347
METRIC RANK
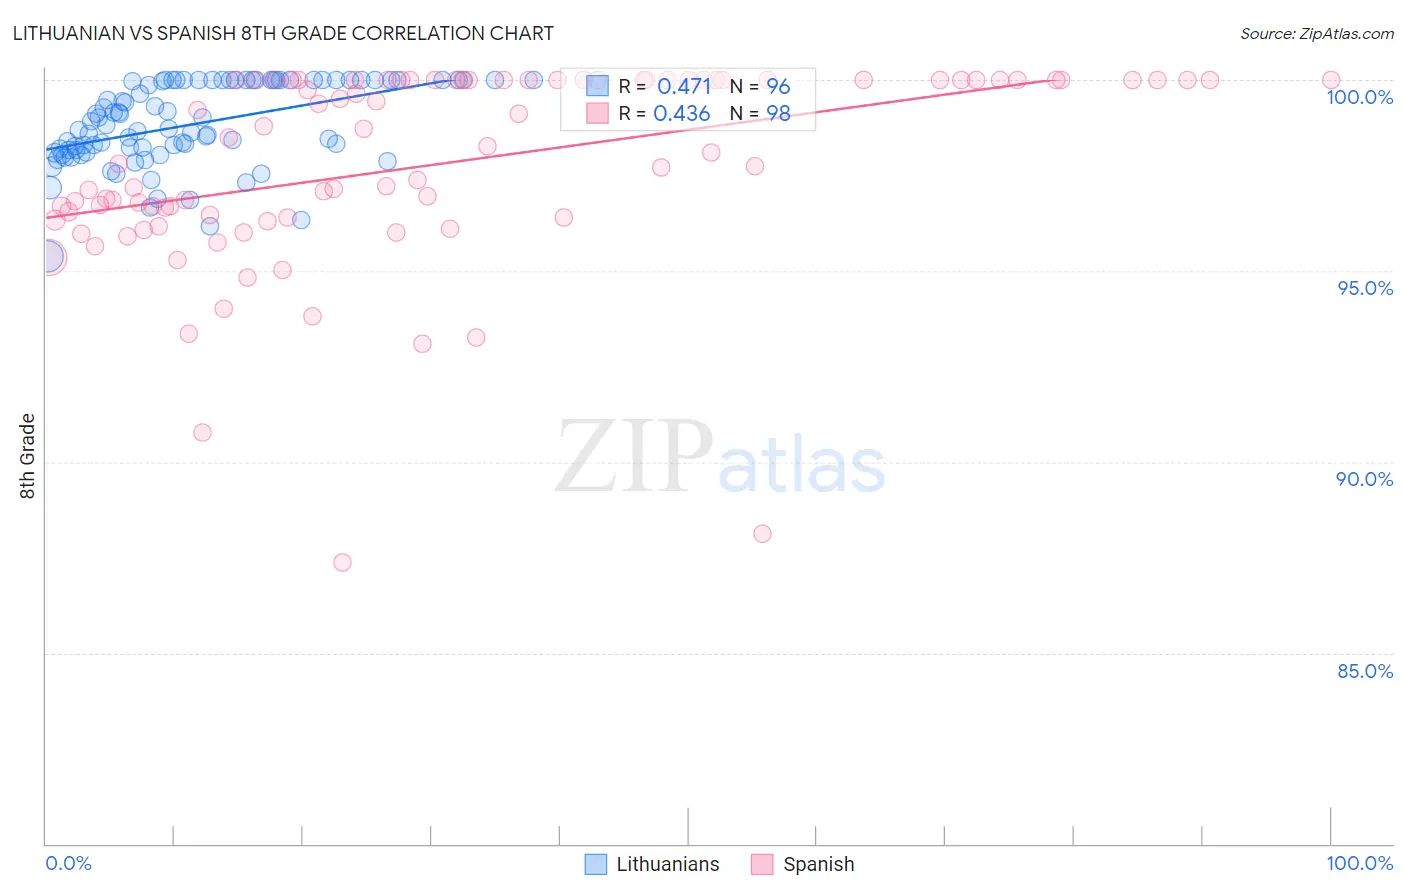
Lithuanian vs Spanish 8th Grade Correlation Chart
The statistical analysis conducted on geographies consisting of 421,948,041 people shows a moderate positive correlation between the proportion of Lithuanians and percentage of population with at least 8th grade education in the United States with a correlation coefficient (R) of 0.471 and weighted average of 97.3%. Similarly, the statistical analysis conducted on geographies consisting of 422,189,188 people shows a moderate positive correlation between the proportion of Spanish and percentage of population with at least 8th grade education in the United States with a correlation coefficient (R) of 0.436 and weighted average of 96.0%, a difference of 1.3%.
8th Grade Correlation Summary
| Measurement | Lithuanian | Spanish |
| Minimum | 95.4% | 87.4% |
| Maximum | 100.0% | 100.0% |
| Range | 4.6% | 12.6% |
| Mean | 98.8% | 97.8% |
| Median | 98.8% | 98.4% |
| Interquartile 25% (IQ1) | 98.1% | 96.4% |
| Interquartile 75% (IQ3) | 100.0% | 100.0% |
| Interquartile Range (IQR) | 1.9% | 3.6% |
| Standard Deviation (Sample) | 1.1% | 2.6% |
| Standard Deviation (Population) | 1.1% | 2.6% |
Similar Demographics by 8th Grade
Demographics Similar to Lithuanians by 8th Grade
In terms of 8th grade, the demographic groups most similar to Lithuanians are Irish (97.3%, a difference of 0.010%), Scottish (97.3%, a difference of 0.010%), Tlingit-Haida (97.3%, a difference of 0.020%), Pennsylvania German (97.3%, a difference of 0.050%), and Alaskan Athabascan (97.3%, a difference of 0.060%).
| Demographics | Rating | Rank | 8th Grade |
| Poles | 100.0 /100 | #11 | Exceptional 97.4% |
| Swedes | 100.0 /100 | #12 | Exceptional 97.4% |
| Alaskan Athabascans | 100.0 /100 | #13 | Exceptional 97.3% |
| English | 100.0 /100 | #14 | Exceptional 97.3% |
| Pennsylvania Germans | 100.0 /100 | #15 | Exceptional 97.3% |
| Tlingit-Haida | 100.0 /100 | #16 | Exceptional 97.3% |
| Irish | 100.0 /100 | #17 | Exceptional 97.3% |
| Lithuanians | 100.0 /100 | #18 | Exceptional 97.3% |
| Scottish | 100.0 /100 | #19 | Exceptional 97.3% |
| Croatians | 100.0 /100 | #20 | Exceptional 97.2% |
| Danes | 100.0 /100 | #21 | Exceptional 97.2% |
| Welsh | 100.0 /100 | #22 | Exceptional 97.2% |
| French Canadians | 100.0 /100 | #23 | Exceptional 97.2% |
| Scandinavians | 100.0 /100 | #24 | Exceptional 97.2% |
| Czechs | 100.0 /100 | #25 | Exceptional 97.1% |
Demographics Similar to Spanish by 8th Grade
In terms of 8th grade, the demographic groups most similar to Spanish are Immigrants from Eastern Europe (96.0%, a difference of 0.0%), Immigrants from Belarus (96.0%, a difference of 0.0%), Immigrants from Greece (96.0%, a difference of 0.010%), Lumbee (96.0%, a difference of 0.010%), and Israeli (96.0%, a difference of 0.010%).
| Demographics | Rating | Rank | 8th Grade |
| Jordanians | 91.3 /100 | #136 | Exceptional 96.1% |
| Cambodians | 90.6 /100 | #137 | Exceptional 96.1% |
| Burmese | 90.2 /100 | #138 | Exceptional 96.1% |
| Hmong | 89.7 /100 | #139 | Excellent 96.1% |
| Immigrants | South Central Asia | 89.4 /100 | #140 | Excellent 96.1% |
| Immigrants | Greece | 85.9 /100 | #141 | Excellent 96.0% |
| Immigrants | Eastern Europe | 85.4 /100 | #142 | Excellent 96.0% |
| Spanish | 85.1 /100 | #143 | Excellent 96.0% |
| Immigrants | Belarus | 84.8 /100 | #144 | Excellent 96.0% |
| Lumbee | 84.1 /100 | #145 | Excellent 96.0% |
| Israelis | 84.1 /100 | #146 | Excellent 96.0% |
| Colville | 84.0 /100 | #147 | Excellent 96.0% |
| Albanians | 83.1 /100 | #148 | Excellent 96.0% |
| Immigrants | Israel | 81.3 /100 | #149 | Excellent 96.0% |
| Immigrants | Russia | 80.9 /100 | #150 | Excellent 96.0% |