Tsimshian vs Asian High School Diploma
COMPARE
Tsimshian
Asian
High School Diploma
High School Diploma Comparison
Tsimshian
Asians
91.3%
HIGH SCHOOL DIPLOMA
99.9/ 100
METRIC RATING
36th/ 347
METRIC RANK
89.4%
HIGH SCHOOL DIPLOMA
70.7/ 100
METRIC RATING
152nd/ 347
METRIC RANK
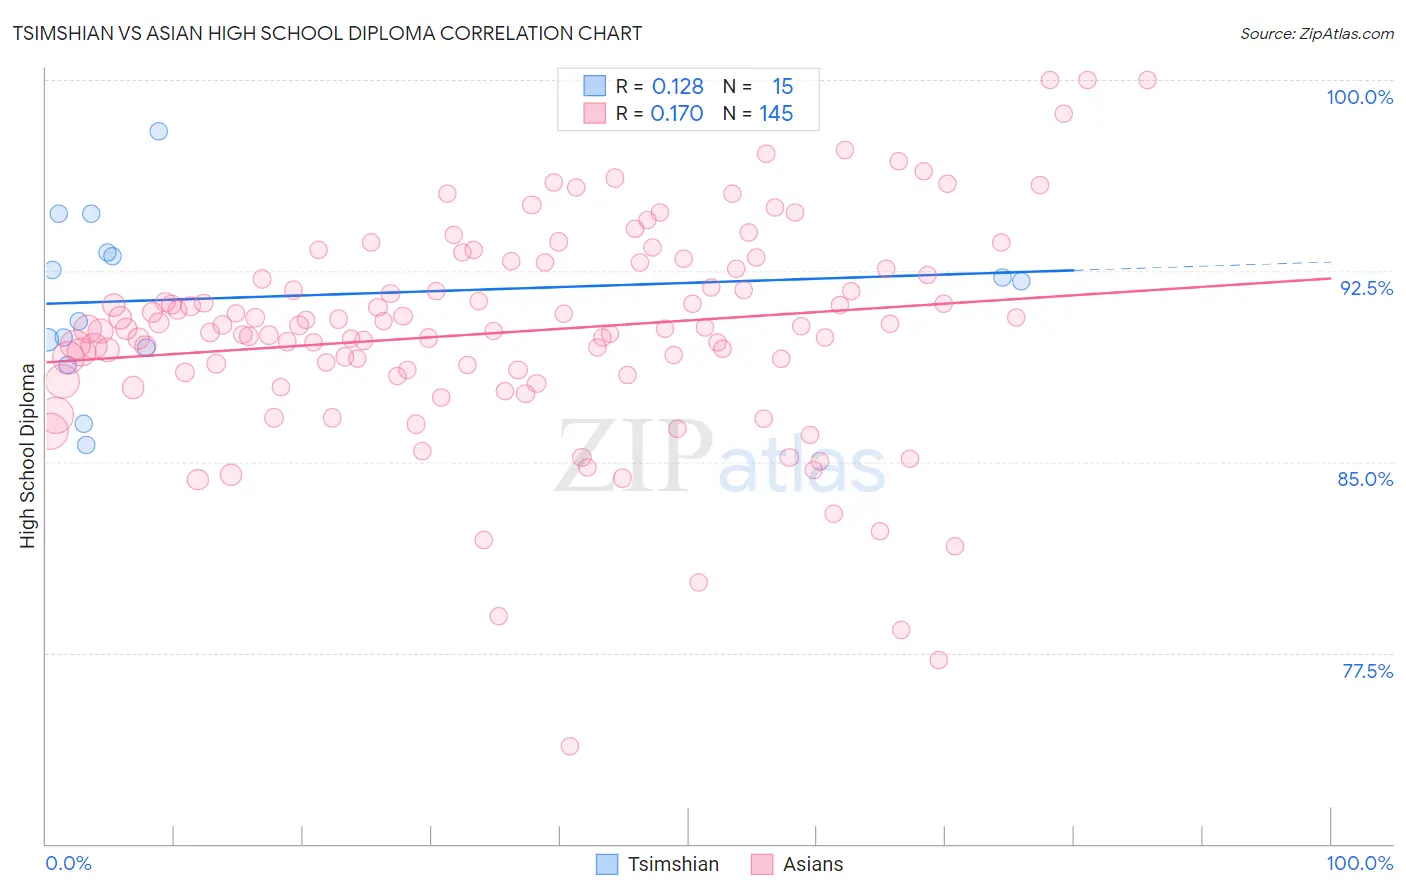
Tsimshian vs Asian High School Diploma Correlation Chart
The statistical analysis conducted on geographies consisting of 15,626,544 people shows a poor positive correlation between the proportion of Tsimshian and percentage of population with at least high school diploma education in the United States with a correlation coefficient (R) of 0.128 and weighted average of 91.3%. Similarly, the statistical analysis conducted on geographies consisting of 550,718,935 people shows a poor positive correlation between the proportion of Asians and percentage of population with at least high school diploma education in the United States with a correlation coefficient (R) of 0.170 and weighted average of 89.4%, a difference of 2.1%.
High School Diploma Correlation Summary
| Measurement | Tsimshian | Asian |
| Minimum | 85.7% | 73.8% |
| Maximum | 98.0% | 100.0% |
| Range | 12.3% | 26.2% |
| Mean | 91.4% | 90.1% |
| Median | 92.1% | 90.2% |
| Interquartile 25% (IQ1) | 89.5% | 88.5% |
| Interquartile 75% (IQ3) | 93.2% | 92.6% |
| Interquartile Range (IQR) | 3.8% | 4.1% |
| Standard Deviation (Sample) | 3.2% | 4.2% |
| Standard Deviation (Population) | 3.1% | 4.2% |
Similar Demographics by High School Diploma
Demographics Similar to Tsimshian by High School Diploma
In terms of high school diploma, the demographic groups most similar to Tsimshian are Immigrants from Ireland (91.3%, a difference of 0.020%), Irish (91.4%, a difference of 0.030%), Immigrants from Scotland (91.3%, a difference of 0.040%), Dutch (91.3%, a difference of 0.050%), and Okinawan (91.4%, a difference of 0.060%).
| Demographics | Rating | Rank | High School Diploma |
| Europeans | 99.9 /100 | #29 | Exceptional 91.4% |
| Iranians | 99.9 /100 | #30 | Exceptional 91.4% |
| Immigrants | Northern Europe | 99.9 /100 | #31 | Exceptional 91.4% |
| English | 99.9 /100 | #32 | Exceptional 91.4% |
| Okinawans | 99.9 /100 | #33 | Exceptional 91.4% |
| Scottish | 99.9 /100 | #34 | Exceptional 91.4% |
| Irish | 99.9 /100 | #35 | Exceptional 91.4% |
| Tsimshian | 99.9 /100 | #36 | Exceptional 91.3% |
| Immigrants | Ireland | 99.9 /100 | #37 | Exceptional 91.3% |
| Immigrants | Scotland | 99.8 /100 | #38 | Exceptional 91.3% |
| Dutch | 99.8 /100 | #39 | Exceptional 91.3% |
| Immigrants | Lithuania | 99.8 /100 | #40 | Exceptional 91.3% |
| Immigrants | Australia | 99.8 /100 | #41 | Exceptional 91.3% |
| Northern Europeans | 99.8 /100 | #42 | Exceptional 91.3% |
| British | 99.8 /100 | #43 | Exceptional 91.3% |
Demographics Similar to Asians by High School Diploma
In terms of high school diploma, the demographic groups most similar to Asians are Paraguayan (89.5%, a difference of 0.010%), Argentinean (89.5%, a difference of 0.030%), Immigrants from Poland (89.5%, a difference of 0.040%), Immigrants from Iraq (89.4%, a difference of 0.040%), and Immigrants from Lebanon (89.5%, a difference of 0.050%).
| Demographics | Rating | Rank | High School Diploma |
| Immigrants | Brazil | 76.6 /100 | #145 | Good 89.5% |
| Immigrants | Spain | 76.2 /100 | #146 | Good 89.5% |
| Iraqis | 73.9 /100 | #147 | Good 89.5% |
| Immigrants | Lebanon | 73.4 /100 | #148 | Good 89.5% |
| Immigrants | Poland | 72.9 /100 | #149 | Good 89.5% |
| Argentineans | 72.3 /100 | #150 | Good 89.5% |
| Paraguayans | 71.4 /100 | #151 | Good 89.5% |
| Asians | 70.7 /100 | #152 | Good 89.4% |
| Immigrants | Iraq | 68.7 /100 | #153 | Good 89.4% |
| Alsatians | 66.8 /100 | #154 | Good 89.4% |
| Immigrants | Northern Africa | 66.4 /100 | #155 | Good 89.4% |
| Immigrants | Argentina | 65.5 /100 | #156 | Good 89.4% |
| Immigrants | Malaysia | 63.5 /100 | #157 | Good 89.3% |
| Immigrants | Pakistan | 62.5 /100 | #158 | Good 89.3% |
| Immigrants | China | 62.0 /100 | #159 | Good 89.3% |